How to make XY scatter plot in Excel
Hello, My Dear Friends, !! In this video, I will show you How to make an XY scatter plot in Excel. Watch the video till the end Thanks.
Here,s How to make an XY scatter plot in Excel :
~~~~~~~~~~~~~~~~~~~~~~~~~~~~~~~~~~~~~~~~~~
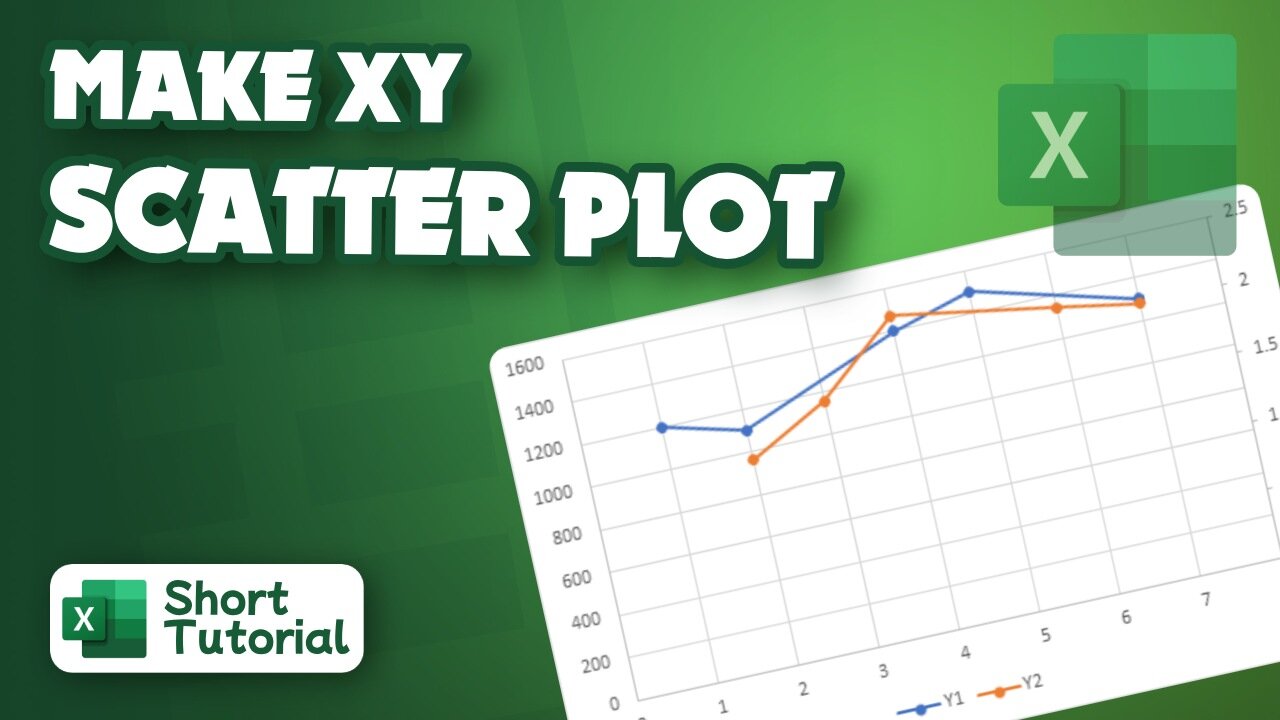
Step 1: Select the data you want to plot in the chart.
Step 2: Click the Insert tab, and then click X Y Scatter, and under Scatter, pick a chart.
Step 3: With the chart selected, click the Chart Design tab to do any of the following: Click Add Chart Element to modify details like the title, labels, and legend.
Chapters:
0:00 Introduction
0:13 Make XY scatter plot in Excel
2:47 Happy Ending
Thank you Everyone for watching. If this video can help you, don't forget to like & subscribe to my channel.
#initial #solution #make #XY #scatter #plot #in #Excel
-
 2:04:52
Kim Iversen
15 hours agoElon's Pumping Out Babies Like They're Tesla Model 3's | EU Panics Over Peace Talks, Wants More War
168K171 -
 1:05:35
Man in America
17 hours agoFort Knox & Trump’s Secret Gold Move—The Financial Reset NO ONE Is Ready For?
119K134 -
 2:21:20
Robert Gouveia
14 hours agoTrump Goes to SCOTUS! Judge CAVES on DOGE? Fani Willis Not Happy!
134K34 -
 20:41
20:41
Stephen Gardner
14 hours ago🔥You Won't BELIEVE What JUST Happened To Don Trump Jr.!!
145K229 -
 58:00
58:00
The StoneZONE with Roger Stone
12 hours agoEuropean Leaders Resist Trump Peace Overtures To Their Own Demise | The StoneZONE w/ Roger Stone
103K12 -
 9:29
9:29
AlaskanBallistics
14 hours ago $12.57 earnedWyoming Suppressors and Rifles at Shot Show 2025
118K6 -
 1:06:40
Donald Trump Jr.
18 hours agoThe Left is Taking one L After Another, Live with Michael Knowles | Triggered Ep. 217
207K159 -
 47:17
47:17
Kimberly Guilfoyle
18 hours agoWoke Gets DOGE’d, Live with AJ Rice & Jarrett Stepman | Ep. 197
148K46 -
 20:11
20:11
Candace Show Podcast
16 hours agoBecoming Brigitte: Candace Owens x Xavier Poussard | Ep 6
221K383 -
 8:25:38
Dr Disrespect
21 hours ago🔴LIVE - DR DISRESPECT - ELDEN RING DLC - REVENGE
207K23