Premium Only Content

Movie Revenue. Journal of Mumbo Jumbo, 2023
(Re-upload to correct the mathematics)
Movies are wonderful things.
People pay money for movies.
Looking at the movie gross receipts, they look like a logarithmic curve.
Why would this be? Often in Physics if the individual bits of a system decide for themselves exponentials make a reasonable model.
A radioactive nucleus will decay, independent of whether there are other atoms around it.
The attenuation of light through a medium often follows Beer’s exponential law.
And perhaps movie tickets.
If we look at a typical box office return we might be tempted to say that:
The change in money, in a unit of time decreases, for example with some coefficient K, and is inversely proportional to time.
Or a differential equation d M, d t equals k over t.
Integrating: we can write M, the money equals K, some coefficient, multiplied by time Log (T)
A little jiggery-pokery is slipped in here, where we rescale the time, by adding one to the time to prevent the equation blowing up. Anyone familiar with quantum field theory or string theory will hardly care about such a sin.
If we believe this equation of M equals K log t, we ought to be able to plot some results, and if physics means anything, make predictions.
Firstly, for our crackpot theory, M, money, ought to be a straight line when plotted against log t.
We present three movies.
First Indiana Jones and the dial of destiny.
For the first twenty days of this film, the coefficient K is approximately 52 million dollars,
And the graph does appear reasonably linear, with an r squared factor around zero point 98.
If the formula was still valid after 100 days, we would predict a domestic gross of 240 million dollars.
Next, the little Mermaid.
Using 55 days of data, the coefficient K is 77 million dollars, and the model has an r squared value of zero point 99. Applying the model, if the little mermaid stayed in theatres, then after 100 days the total domestic would grow to 355 million.
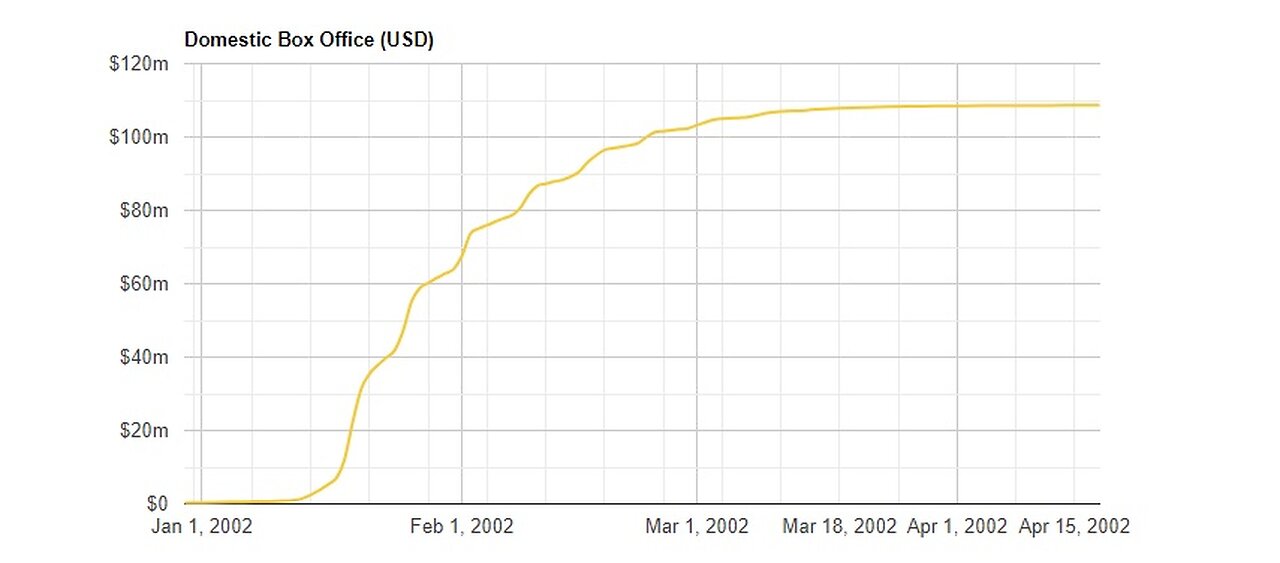
Finally, taking something from out of the vault, Black Hawk down, from 20 years ago.
We have data for days 22 to days 69 for Black hawk down, and the model again has a correlation r squared value of 0.97. The coefficient K for black Hawk down had a value of 27 million dollars. This is an interesting case, as its results for the first 21 days are not reported on the website “The Numbers”, and it was released around December 2001, on the heels of the September eleventh attacks.
In its later stages, the model has a 97 percent r squared value. In terms of earnings, it might as well have been released on the seventeenth of January.
Now, discussing these results, we might ask, we note several things.
One, a correlation of 99 percent or so is obtained for our silly model, 97 percent for BHD. Meaning, about 99 percent of the data is explained by it. The model assumes the increase in earnings is inversely proportional to the time in the box office, or daily earnings equals K over t, where K is a coefficient, and t is the time since release.
Two, for this model, the coefficient K, determines how far the movie goes. If we multiply the time by natural log of t, or two point seven one, we gain K units of money.
For example, for Indiana Jones and the dial of destiny, for the first natural log of t days, or 2.71, days, the movie gains K dollars, or 52 million.
The natural log equals two when we multiply that time by two point seven one again, or in 7.4 days, the income has grown by another K dollars, or to 104 million.
After 20 days, which is the natural log three days, the gross income has grown to three K, or around 156 million. Using this model, to obtain another K units of income, we would have to wait two point seven one times as long, or to day 55. For five units of K income, we hang around to day 148.
Naturally, any model eventually passes from usefulness. In analogy of the attenuation of light through a medium, once the light has travelled through it, there is no more attenuation. Similarly, once the movie is out of theatres, and the income per day no longer sustains the theatre, the movie is pulled, and the model lo longer applies.
If Indiana Jones and the dial of destiny was to stay in theaters for 100 days, we would predict a domestic gross of 240 million dollars.
And, According to "The Numbers":
After 77 days, IJ5 topped:
$174 Million Domestic.
With the income on the final day being:
$59 per theater in 100 reported theaters.
Or about $66 million below our projection.
-
 2:33:51
John Crump Live
17 hours ago $22.06 earnedSaturday Night Main Event!
98.5K10 -
 13:57
13:57
TimcastIRL
23 hours agoTrump NUKES IRS After DOGE Investigation, OVER 9000 Employees To Be FIRED
116K170 -
 13:35
13:35
Russell Brand
16 hours agoPFIZER JUST MADE THEIR NEXT MOVE AND EXPERTS ARE TERRIFIED
138K271 -
 1:15:57
Victor Davis Hanson Show
1 day agoOver Here, Over There: the Russo-Japanese War and Trumpian Peace Policy
65.6K35 -
 23:55
23:55
MYLUNCHBREAK CHANNEL PAGE
1 day agoThe Nephilim Are Here
92.8K86 -
 1:00:58
Break The Cycle w/ Joshua Smith
13 hours ago $1.72 earnedBreak The Cycle Ep. 247: Funny Guys w/ Robbie "The Fire" Bernstein
28.7K1 -
 41:26
41:26
TheTapeLibrary
1 day ago $9.94 earnedThe Disturbing Horrors of the Trans-Allegheny Lunatic Asylum
60.2K6 -
 10:07
10:07
Tundra Tactical
14 hours ago $6.72 earnedTRUMP'S HUGE GUN RIGHTS MOVE!
41.2K9 -
 1:53:23
Mally_Mouse
13 hours agoSaturday Shenanigans!! - Crowd Control - Content Warning
31K1 -
 17:24
17:24
Exploring With Nug
19 hours ago $3.67 earnedScuba Diving on Underwater Cars Searching For Missing Man!
41.7K1