Premium Only Content

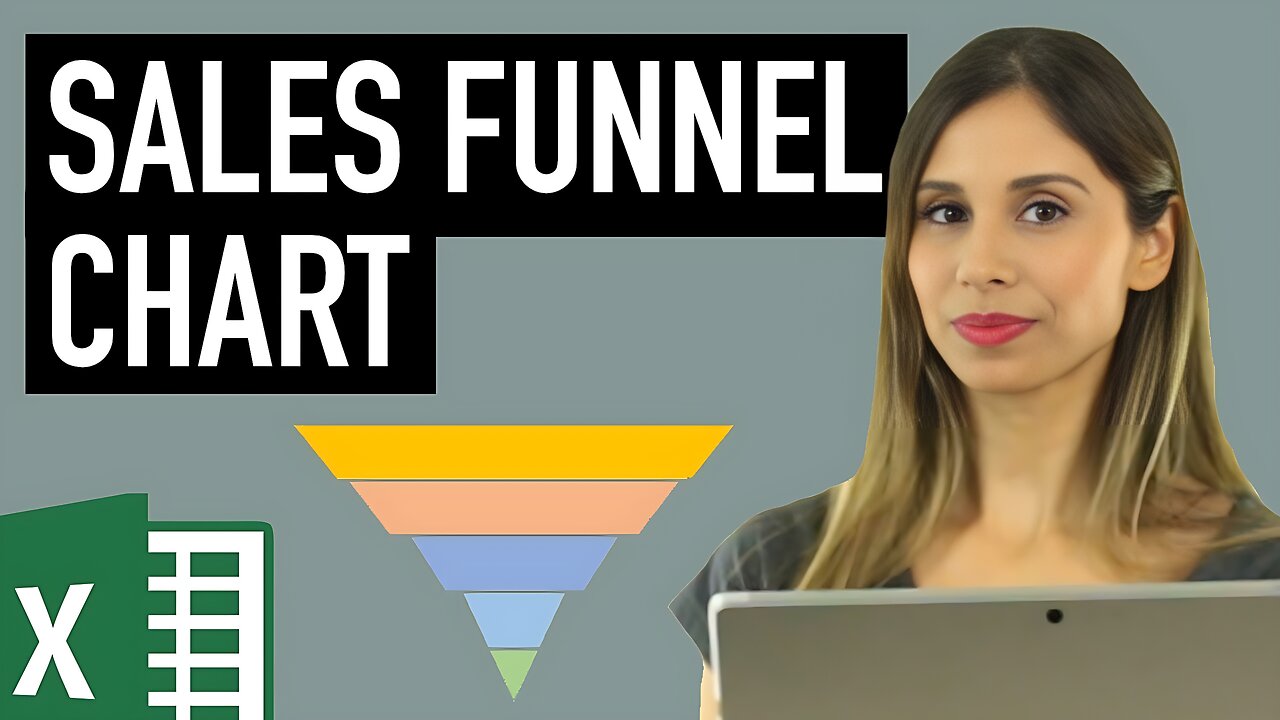
How to Create a Sales Funnel Chart in Excel (Not the "usual" Funnel)
November 15, 2018 Excel Infographic Chart Templates
Check the Excel Essentials Course: https://courses.xelplus.com/p/learn-excel-essentials
Quickly learn how to create a sales funnel chart in Excel.
Excel 2016 has a built-in sales funnel graph, but what it doesn't have is a funnel chart that looks like a funnel.
In this tutorial I show you how you can tweak the existing funnel chart to make it look more like a funnel. I do this with the help of Smart-art in Excel. I use the Pyramid Smartart, adjust it to fit the number of categories needed for the funnel and then convert the Smartart to a shape. Watch the video to see how you can copy these shapes into the chart and adjust the look of the funnel.
🡻 Download the workbook here: https://www.xelplus.com/funnel-chart/
★ Links to related videos: ★
Excel charts and graphs playlist: https://www.youtube.com/playlist?list=PLmHVyfmcRKyyEj7oQkCf7TL9yQQWXbGOQ
Excel Info-graphics: https://www.youtube.com/playlist?list=PLmHVyfmcRKyw08u-MZm4ROnB3J0gRlsop
★★ My Online Excel Courses ★★
Courses ► https://courses.xelplus.com/
🕮 Excel Resources I Recommend 🕮
https://www.xelplus.com/resources/
✉ Subscribe & get my Excel top 10 tips and formulas e-book for free
https://www.xelplus.com/free-ebook/
-
 1:00:56
The Tom Renz Show
8 hours agoThe War On DOGE Is ALSO A War On The Economy
4.95K5 -
 1:30:16
Steve-O's Wild Ride! Podcast
5 days ago $0.84 earnedAri Shaffir Exposes The Dark Side of Podcasting - Wild Ride #252
11.3K1 -
 1:56:29
The Quartering
6 hours agoAirplane FLIPS and CRASHES, Sean Duffy Slams Pete Buttigieg, & What Happened with Patriarchy Hannah
66.8K30 -
 37:08
37:08
Standpoint with Gabe Groisman
23 hours agoDOGE The UK?! With Liz Truss
41.3K12 -
 56:39
56:39
SLS - Street League Skateboarding
6 days agoHIGHEST SCORING KNOCKOUT ROUND OF ALL TIME! Felipe Gustavo, Dashawn Jordan, Filipe Mota & more...
21.7K1 -
 14:26
14:26
Breaking Points
1 day agoWOKE VS BASED?: Saagar And Ryan Play A Game
24.2K6 -
 5:29:58
SoundBoardLord
8 hours agoThe Red Dead Journey Continues!!!
23.1K1 -
 1:17:31
The Officer Tatum
4 hours agoLIVE: Delta Airlines CRASH BLAMED On Trump, Ashley St. Claire Had Elon's BABY? + More | Ep 63
29.7K37 -
 1:38:08
vivafrei
6 hours agoAOC goes Full Criminal Lover? Mehdi Hasan Goes Full Terrorist? Another Plane Crash & MORE! Viva Frei
71.8K36 -
 1:52:19
Russell Brand
6 hours agoLIVE FROM MAR A LAGO: US, Russia & China to Negotiate While UK Ramps Up in Ukraine – SF539
150K51