Premium Only Content

How To Tell When The Stock Market Is Overvalued
In this video we go over 4 key methods to tell when the stock market is overvalued. The Market P/E, the Shiller P/E, The Buffett Indicator & Overall Market Returns.
https://www.multpl.com/s-p-500-pe-ratio
https://www.multpl.com/shiller-pe
📊 Sven Carlin (Expert Investor) Portfolio & Free Investing Course: http://bit.ly/SvenCarlinPortfolio
📈 How To Invest Course: http://bit.ly/theinvestingacademy-how-to-invest-in-the-stock-market
__________________________________
One of the most asked questions that investors are curious about, is how do you tell whether the stock market is overvalued? Are prices too high, should we wait for the market to go down, or is now actually a fine time to get in?
And this is an important question to ask, because let’s be honest no one likes putting there money in the stock market and then seeing prices fall. It’s not a fun experience, I’ve certainly gone through it before.
But there are a number of indicators that we can look at in order to determine if the market is overvalued. Or at the very least get a good feel for where market valuations stand.
In this video we’re going to explain the 4 key indicators that we can use to determine whether a market is overvalued, fair valued or underpriced… I’m going to use todays USA market as an example but you can use market at any time with these indicators…
Method 1: The Market P/E Ratio
Now I’m sure you’ve heard of this metric before, the p/e ratio. Or price to earnings ratio. I don’t know if you’re aware of this but you can actually get the p/e ratio of the entire market as a whole. And you can use this to get a feel for if things are overvalued. Let me explain...
So the market p/e ratio, what you first need, is a guage of the entire market.
Now in the USA, they have an index called the S & P 500.
The S & P 500 measures the performance of 500 very large and popular companies in the States. Essentially this index tracks the entire USA market, it’s known as a benchmark for the market as a whole.
So what we do is get the price of the index aka how much do stocks overall cost, and then you compare this to the earnings. Aka how much money are the stocks bringing in. In terms of profit of course.
So cost versus profit it’s the oldest benchmark figure in the book.
And the P/E is simple to find. All we do is a good old google search. And we go on the website multipl.com which shows us this graph.
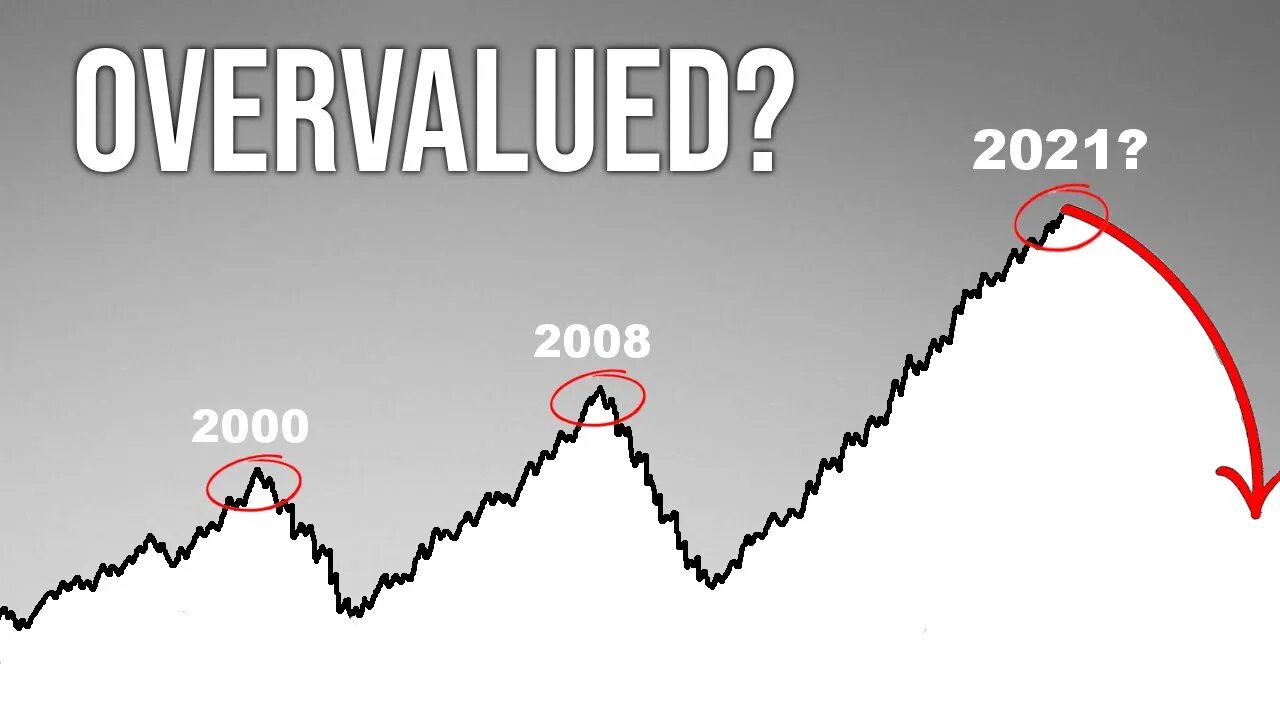
Now as you can see, the current S & P 500 p/e ratio is 32.95. If you take that and look through history, you can see that it’s quite a bit higher than it’s normal figure. The average p/e ratio throughout history is 15.85. Right now it’s double that, which isn’t a good sign.
I mean the p/e ratio is similar to what it was back in 1999. Where the dot com crash was just about to happen. In 1999 the market p/e was 32.9. This potentially means the current market may be overvalued… But we have to look at the other indicators in order to confirm this hypothesis…
Method 2: Shiller P/E Ratio.
Now there’s investors who’ve come along and criticized the traditional p/e ratio for measuring the market. They say earnings in a particular year can fluctuate because of business cycles and thus it’s not accurate. That’s where Professor Robert Shiller came along and he developed something called the Shiller P/E ratio.
What he did was he averaged the earnings over the past 10 years and adjusted them for inflation so that market fluctuations would not be in the equation.
And thus a lot of investors believe it’s a more accurate way of measuring the market.
Anyway so currently the Shiller p/e ratio sits at 30.27. That’s a lot higher than what it normally is if you look back through history. The average Shiller p/e throughout history, the past 100 years or so is 16.75. So it’s about 14 points higher than the average at the current point in time of making this video.
However the average over the past 20 years is 25.6 which would make things seem a whole lot more reasonable... (ok that's all I can fit in)
Subscribe Here: https://bit.ly/2Y1kNq8
___
DISCLAIMER: It's important to note that I am not a financial adviser and you should do your own research when picking stocks to invest in. These are just some of my viewpoints, by no means would I recommend watching one YouTube video and then immediately buying that stock. This video was made for educational and entertainment purposes only. Consult your financial adviser.
-
 13:27
13:27
IsaacButterfield
1 day ago $2.09 earnedVEGAN BOOTY “RACIST”
23.2K55 -
 16:31
16:31
RealReaper
12 hours ago $1.58 earnedThe Last of Us S02E01 Weak Men and Annoying Girlbosses
30.2K22 -
 18:10
18:10
Degenerate Jay
13 hours ago $0.97 earnedIs This Ruining Assassin's Creed? - The Brand Loyalty Problem
26.2K -
 50:46
50:46
Esports Awards
18 hours agodGon on Korean League of Legends Dominance, Working the LCS & 2025 Predictions | Origins Podcast #4
28.2K2 -
 12:48
12:48
T-SPLY
17 hours agoDemocrats Keep Digging Their Own Hole Over El Salvadorian Prisoners
49.2K69 -
 2:55:26
FreshandFit
12 hours agoLuke Belmar ROASTS Girls For Being High And Unmarried!
141K123 -
 2:16:58
Badlands Media
13 hours agoDevolution Power Hour Ep. 348: Culture War Cage Match – Trump, UFC, and Narrative Warfare
109K40 -
 4:08:04
Akademiks
10 hours agoDay 8/30. Shannon Sharpe Over Cooked? Accuser Drops more Audio.' Uzi Rushed to Hospital? Kevin Gates
77.1K15 -
 8:08
8:08
JustPearlyThings
9 hours agoPearl Daily Live Stream
52.7K12 -
 1:00:04
Iggy Azalea
10 hours ago $11.24 earnedF**K strategy Its boring. Risky moves only tonight...
77.3K24