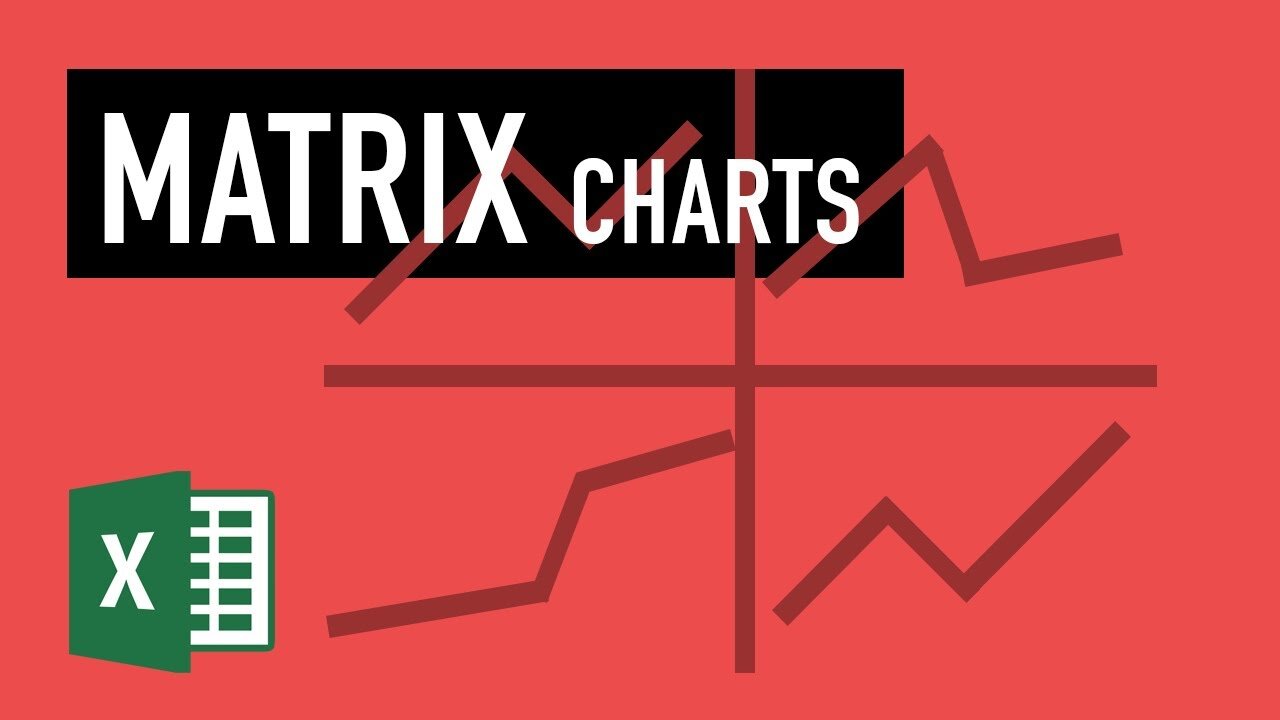
Excel Charts: Matrix or Excel Panel Charts - Showing many variables at once
Aug 9, 2016 Excel Charts
Complete Advanced Excel Chart Course: http://www.xelplus.com/advancedexcelchartcourse
Download the Excel Workbook Here: http://www.xelplus.com/excel-panel-charts-matrix-excel-charts/
Excel Advanced Charts & Graphs Tutorials: Matrix or Excel Panel Charts - Showing many variables at once
Video Summary:
When you have too much to show in an Excel Chart don’t do it in a single graph. It would create a color collage and take too much energy from your readers to try to understand the message. What you can do is create what looks like multiple charts and show them horizontally. You can also create chart matrices. Just make sure that you are consistent by using a common axis, size, color, font, spacing etc. Each Excel chart should look like the identical twin of the other, except that it will show a different series or variable. In the example in the video, we have four companies and we’d like to compare the actual profit and the budgeted profit for each company, against one another. We can do this best by showing them as a panel chart. Because the companies are right beside one another and they share a common axis it is very easy to compare.
Sequencing is also an important parameter to consider when designing panel charts. If you have a specific sequence in the organization that you’d like to keep, you might want to keep that order. However, if that doesn’t apply you can also consider sequencing your charts in ascending or descending order based on the total yearly profit. It really depends on your audience and your message.
To design your panel charts as one chart you will need to have your data in a specific order. It's actually quite easy. Watch the video to find out how.
➹ ➹ ➹ My Online Excel Courses ➹ ➹ ➹
Excel Dashboards ► http://bit.ly/LeilaDashboards
Excel Charts ► http://bit.ly/LeilaCharts
Advanced Excel ► http://bit.ly/LeilaAdvancedExcel
Excel Waterfall Charts ► http://bit.ly/LeilaWaterfall
✉ Subscribe to my Newsletter ✉
Stay informed and get discounts when new courses come out: http://www.xelplus.com/
-
 11:22
11:22
Bearing
15 hours ago"Anxious & Confused" Federal Workers FREAK OUT Over DOGE Efficiency Email 💥
27.7K55 -
 1:31:20
Flyover Conservatives
23 hours agoUS STOCK MARKET: Sinking Ship - Dr. Kirk Elliott; How I Fought Back Against Woke Schools & Stopped Gender Bathrooms - Stacy Washington | FOC Show
44.3K1 -
 1:08:09
Donald Trump Jr.
10 hours agoFBI Dream Team, Plus Taking Your Questions Live! | Triggered Ep.219
181K251 -
 7:32:37
Akademiks
9 hours agoDrake and PartyNextDoor '$$$4U' Album Sells 250K first week. BIG AK IS BACK.
105K11 -
 3:12:08
MyronGainesX
8 hours ago $28.37 earnedDan Bongino Named As Deputy Director Of FBI And CPAC Recap
85.6K27 -
 3:12:31
vivafrei
8 hours agoBarnes Live from Seattle - Defending Benshoof in a Case that is CRAY CRAY!
115K39 -
 2:12:12
Robert Gouveia
8 hours agoLiberals EXPLODE over Elon's Email; Lawsuits FLY; Sanctions?? Congrats Dan!
95.1K33 -
 1:33:36
Redacted News
9 hours agoBREAKING! PUTIN LAUNCHES MASSIVE OFFENSIVE IN UKRAINE AS EUROPEAN LEADERS PUSH FOR MORE WAR
175K233 -
 44:39
44:39
Kimberly Guilfoyle
9 hours agoBetter Days Ahead for the FBI, Live with Asm Bill Essayli & John Koufos | Ep.199
110K25 -
 1:40:29
In The Litter Box w/ Jewels & Catturd
1 day agoWhat Did You Do Last Week? | In the Litter Box w/ Jewels & Catturd – Ep. 748 – 2/24/2025
149K40