Premium Only Content

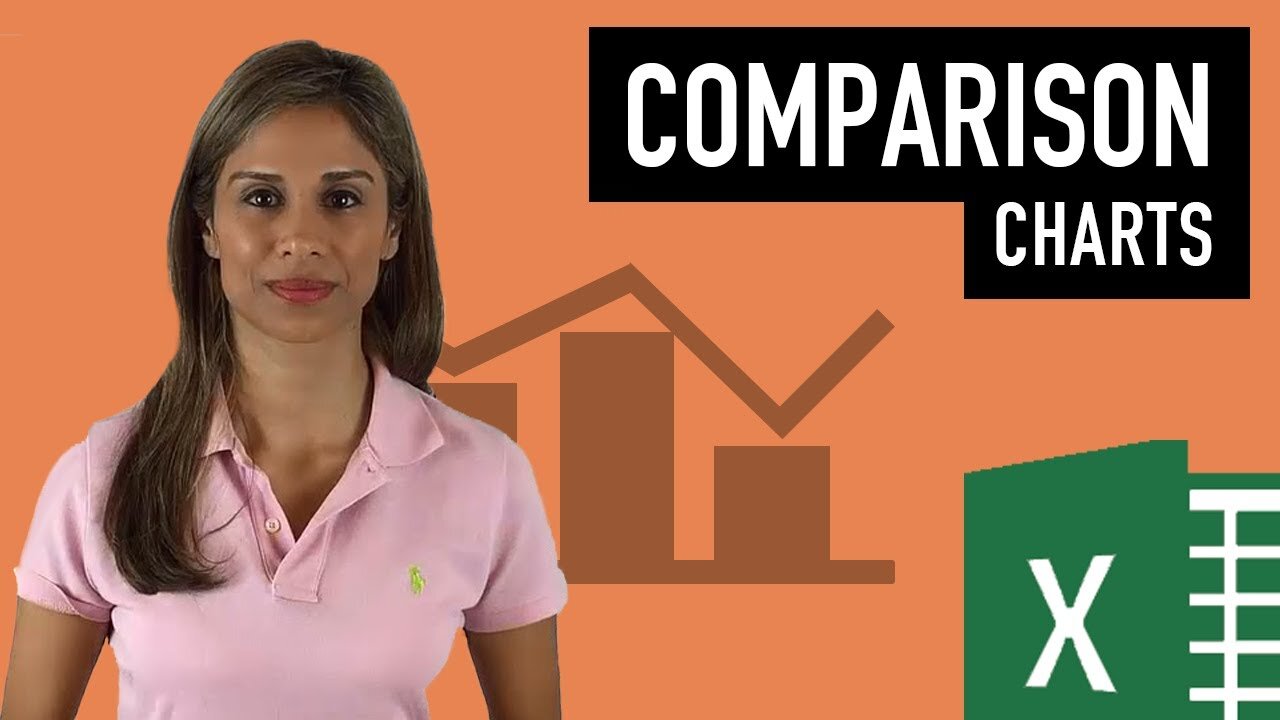
Excel Advanced Charts: Comparison to Budget, Previous Year and Forecast or Outlook
Jan 27, 2016 Excel Charts
Complete Advanced Excel Chart Course: https://courses.xelplus.com
Written instructions: http://www.xelplus.com/companion-charts/
Excel Advanced Charts: Measuring performance, doing comparisons and predicting the future - Comparison to Budget, Previous Year and Forecast or Outlook.
Not sure which charts & methods to use to show performance and variances? This lecture will provide you with some examples that are covered in my Excel online visualization course.
Summary: This lecture provides you with an overview of different methods used for visualizing performance comparisons, deviations, as well as future estimated performance. It introduces you to the topics and charts that you will learn in this section as well as the next two sections.
This is specially beneficial for controllers and financial analysts looking to enhance their corporate reports to include better & improved charts.
Detail: In every corporate report, you have sections where you make comparison of actual values to budget or target values. In this section I will show you the most effective ways of making these comparisons.
You will also compare your performance to PY to see if you did better or worse. There are different way of doing this. My favorites are using symbols and using what I call the pin chart. I will show you these in the next section.
Lastly you will also have reports where you show how you expect to be performing for the rest of the year. These are called your forecasts or outlooks. I will show you some methods of displaying these effectively in Excel in the section after next.
One point to emphasize is the consistent use of colors in your reports. Make sure your actuals have the same colour throughout your reports. They should be clearly in focus and visible. Basically stand out against budget, target, previous year, forecasts and any other series you have.
In the same manner, be consistent with the use of color for your other series.
★ My Online Excel Courses ► https://courses.xelplus.com
✉ Subscribe & get my TOP 10 Excel formulas e-book for free
https://www.xelplus.com/free-ebook/
EXCEL RESOURCES I Recommend: https://www.xelplus.com/resources/
-
 1:01:41
The Charlie Kirk Show
2 hours agoWhat Did YOU Do This Week? + German Elections | Sen. Scott, Sacks, McCarthy | 2.24.2025
26.4K3 -
 2:15:49
Benny Johnson
3 hours ago🚨 New FBI Deputy Director Dan Bongino Speaking LIVE Right Now After SHOCK Trump, Kash Appointment
109K71 -
 52:36
52:36
The Dan Bongino Show
5 hours agoCutesy Time Is Over (Ep. 2429) - 02/24/2025
1.61M7.1K -
 1:10:46
The Rubin Report
3 hours agoLEAKED: Tense Meeting Details Leaked as MSNBC Lays Off Major Hosts
66.5K102 -
 1:03:25
Timcast
4 hours agoDAN BONGINO Named Deputy FBI Director Under Kash Patel, Deep State & Dem IN PANIC | Timcast LIVE
233K93 -
 2:31:41
Steven Crowder
5 hours ago🔴 Trump Drops a Bombshell: Bongino’s FBI Takeover & Crowder in Germany Exclusive
665K259 -
 1:59:34
LFA TV
1 day agoTIME FOR PAYBACK! | LIVE FROM AMERICA 2.24.25 11AM
115K18 -
![🔴[LIVE TRADING] Bounce or Bust?! || The MK Show](https://1a-1791.com/video/fwe2/ad/s8/1/c/n/q/f/cnqfy.0kob-small-The-MK-Show-Feb.-24th.jpg) DVR
DVR
Matt Kohrs
16 hours ago🔴[LIVE TRADING] Bounce or Bust?! || The MK Show
73.7K2 -
 1:03:25
Kyle Fortch
5 hours ago $2.47 earnedRick Barker: Managing & Developing Taylor Swift, Breaking Artists Today & MORE | THE ONE SHEET S1E5
98.6K1 -
 37:11
37:11
BonginoReport
7 hours agoDan Bongino is Leaving (Ep.146) - 02/24/2025
248K475