Premium Only Content
This video is only available to Rumble Premium subscribers. Subscribe to
enjoy exclusive content and ad-free viewing.

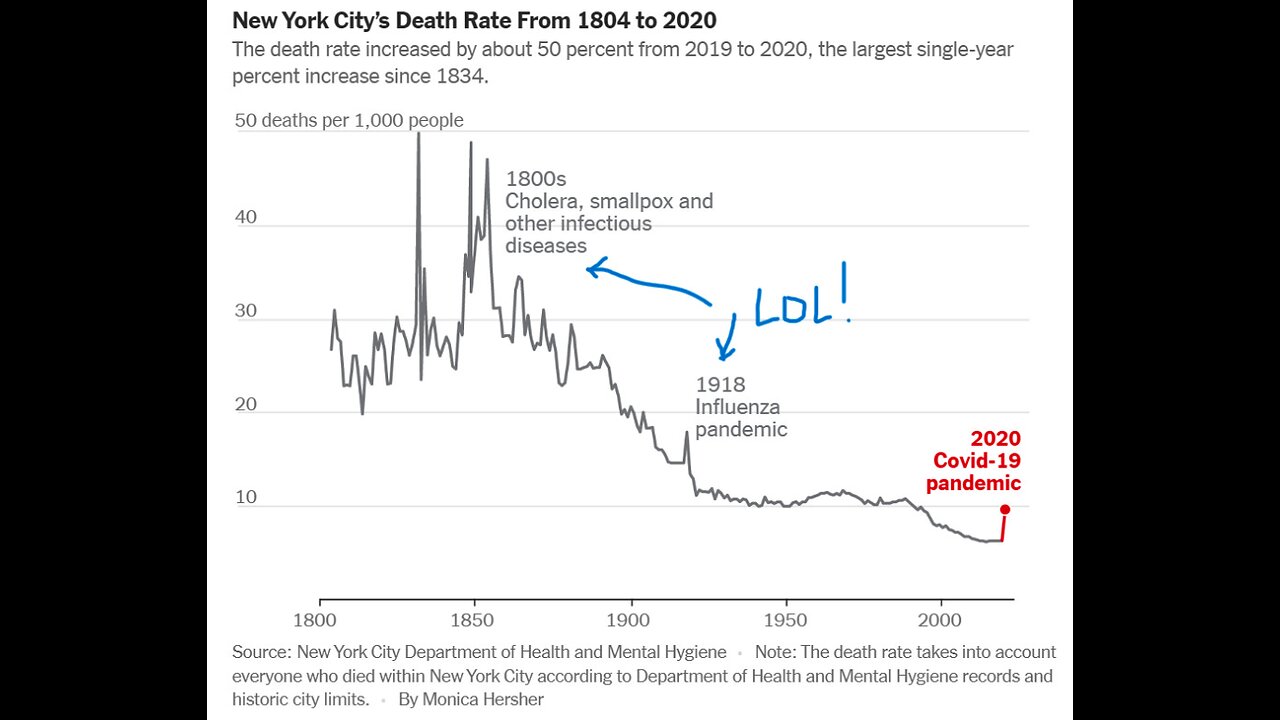
The COVID Con explained in one chart
Repost
Loading comments...
-
 LIVE
LIVE
Rethinking the Dollar
20 minutes agoThe U.S. Debt Crisis That Was "Made In America" w/ Paul Stone
134 watching -
 3:31
3:31
SLS - Street League Skateboarding
1 day agoCoco Yoshizawa’s 3rd Place Finish at SLS Tokyo 2024 | Best Tricks
1.52K1 -
 LIVE
LIVE
Grant Stinchfield
19 hours agoNew: The COVID Cover-up Revealed! Team Biden Caught in a Big Lie!
950 watching -
 LIVE
LIVE
The Shannon Joy Show
14 hours ago🔥🔥LIVE Exclusive W/Daniel Horowitz - New Year 2025 Analysis On Culture, Economy & Politics🔥🔥
596 watching -
 LIVE
LIVE
Tudor Dixon
50 minutes agoThe World Walk with Tom Turcich | The Tudor Dixon Podcast
124 watching -
 LIVE
LIVE
PudgeTV
6 hours ago🔴 Gaming on Rumble - Marvel Rivals | Iron Man's Armory: Equipping Groot and Jeff for Battle
231 watching -
 LIVE
LIVE
The Charlie Kirk Show
36 minutes ago2024 In Review + The Truth About H-1Bs | Girdusky, Carl | 12.30.24
7,476 watching -
 6:51
6:51
The Rubin Report
1 hour agoDave Rubin Reacts to Trump’s Greatest Moments
3.05K3 -
 DVR
DVR
Bannons War Room
1 year agoWarRoom Live
102M -
 0:57
0:57
Steven Crowder
2 hours agoCROWDER CLASSICS: AOC & the Lion’s Den (Bible Story Parody)
47.5K6