Premium Only Content

Australian government data from January 2021
Dr. John Campbell
TGA Pfizer document
https://www.tga.gov.au/sites/default/files/foi-2389-06.pdf
Tissue distribution (lipid nanoparticles encapsulation RNA)
(Page 44)
Rats after i.m. vaccine injection
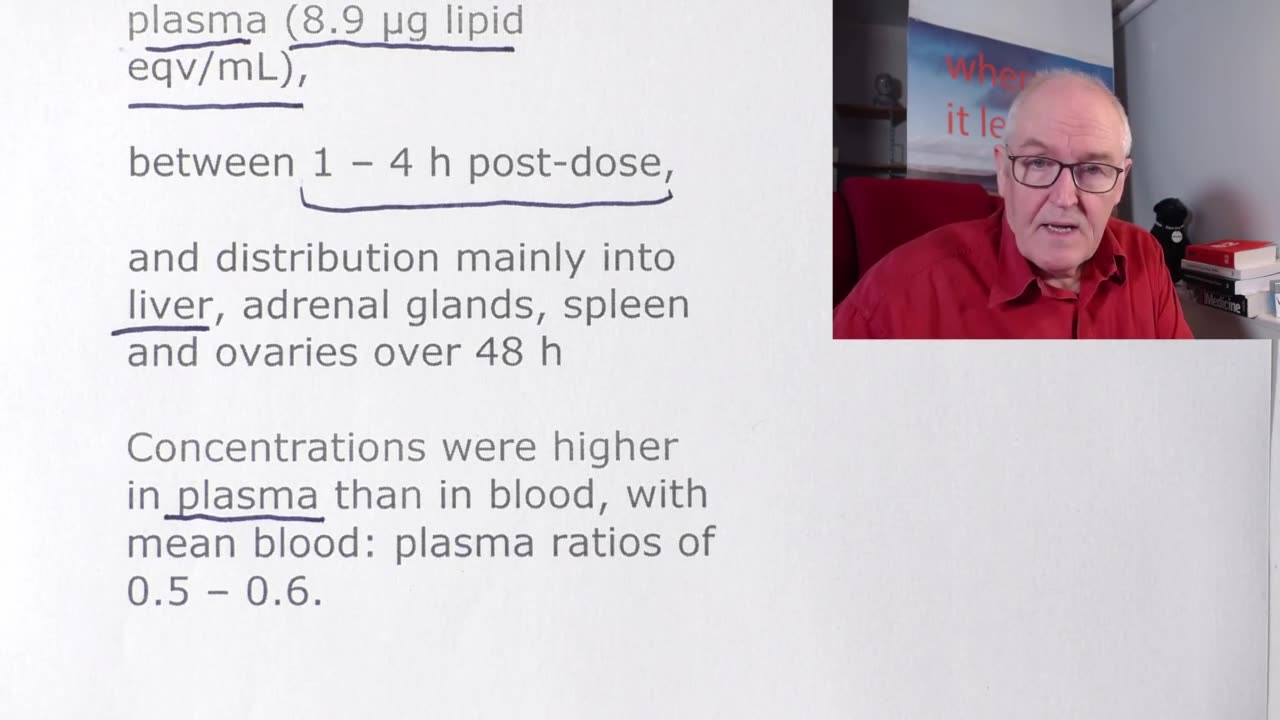
The concentration of radioactive lipid marker reached the peak level in plasma (8.9 μg lipid eqv/mL),
between 1 – 4 h post-dose,
and distribution mainly into liver, adrenal glands, spleen and ovaries over 48 h
Concentrations were higher in plasma than in blood, with mean blood: plasma ratios of 0.5 – 0.6.
DISTRIBUTION (page 40)
The distribution of LNP-BNT162b2 (V9) mRNA or expressed S protein was not studied.
Table 4-2. Mean concentration of radioactivity (sexes combined) in tissue and blood following a single IM dose of 50 μg mRNA/rat
(page 45)
Mean total radioactivity was greatest at the injection site followed by the liver,
with much lower total recovery in spleen, adrenal glands and ovaries
The tissue distribution pattern was similar in 100 μg mRNA/animal dose group as noted above for 50 μg mRNA/animal dose,
with highest distribution into liver, adrenal glands and spleen.
Conclusions
Slow but significant distribution of lipid nanoparticles from the site of injection with major uptake into liver.
Minor distribution in spleen, adrenal glands and ovaries over 48 h.
Mean blood:plasma ratios of 0.5-0.6 indicating nanoparticles mainly present in plasma fraction of blood with peak concentrations in plasma at approx. 2 h post-dose.
-
 LIVE
LIVE
Chrissy Clark
1 hour agoTrump Responds To Woke Bishop, Cardi B’s TikTok FAIL, & MORE I Underreported Stories
259 watching -
 LIVE
LIVE
theDaily302
10 hours agoThe Daily 302 - Colonel Roxane Towner Watkins
103 watching -
 LIVE
LIVE
BlackDiamondGunsandGear
6 hours agoLIVE SHOT SHOW 2025 COVERAGE w/ DLD After Dark
245 watching -
 2:36:32
Omar Elattar
3 hours agoEx-Arms Dealer: "How I Won A $300M Pentagon Contract At 24 & Inspired War Dogs"
7K -
 DVR
DVR
Game On!
2 hours ago $0.14 earnedPUMP THE BRAKES! Patrick Mahomes will NEVER be Tom Brady!
6.56K3 -
 1:04:14
In The Litter Box w/ Jewels & Catturd
23 hours agoBorder Is Closed | In the Litter Box w/ Jewels & Catturd – Ep. 726 – 1/23/2025
76.5K18 -
 1:41:52
The Quartering
6 hours agoDemonic Visitors, ICE Raids Begin, Brett Cooper Drama, Trump Vs Woke Bank, MSM Helping Illegals!
94.9K25 -
 1:53:38
Barry Cunningham
4 hours agoWATCH LIVE: TRUMP DAILY BRIEFING - PETE HEGSETH CONFIRMATION & NEW OTDERS BY PRESIDENT TRUMP
56.3K17 -
 1:08:57
Bare Knuckle Fighting Championship
23 hours agoBKFC KNUCKLEMANIA V PHILADELPHIA PRESS CONFERENCE | LIVE!
56.6K3 -
 2:11:55
vivafrei
8 hours agoTrump is Making Some BAD Decisions! More mRNA "Vaccine" Tyranny? Jan. 6 Release UPDATES! & More!
78.3K178