Premium Only Content

Hammer Pattern - Trade - EhsanTrading
What Is a Hammer Candlestick?
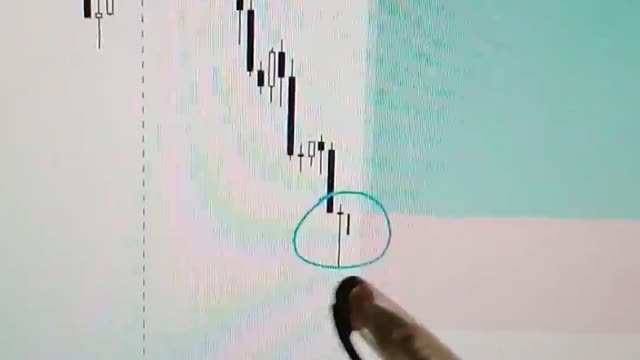
A hammer is a price pattern in candlestick charting that occurs when a security trades significantly lower than its opening, but rallies within the period to close near the opening price. This pattern forms a hammer-shaped candlestick, in which the lower shadow is at least twice the size of the real body. The body of the candlestick represents the difference between the opening and closing prices, while the shadow shows the high and low prices for the period.
Key Takeaways
Hammer candlesticks typically occur after a price decline. They have a small real body and a long lower shadow.
The hammer candlestick occurs when sellers enter the market during a price decline. By the time of market close, buyers absorb selling pressure and push the market price near the opening price.
The close can be above or below the opening price, although the close should be near the open for the real body of the candlestick to remain small.
The lower shadow should be at least two times the height of the real body.
Hammer candlesticks indicate a potential price reversal to the upside. The price must start moving up following the hammer; this is called confirmation.
-
 21:06
21:06
BlackDiamondGunsandGear
7 hours agoPSA Micro Dagger Self-Destructs During Shooting! What Happened…
33K7 -
 6:27:09
Right Side Broadcasting Network
5 days agoLIVE REPLAY: RSBN Pre-Inauguration Coverage: Day Three in Washington D.C. - 1/18/25
268K56 -
 25:09
25:09
MYLUNCHBREAK CHANNEL PAGE
13 hours agoOff Limits to the Public - Pt 2
64.2K46 -
 1:36:11
Tucker Carlson
1 day agoSean Davis: Trump Shooting Update, & the Real Reason Congress Refuses to Investigate
348K409 -
 5:13
5:13
Russell Brand
2 days agoHost GRILLS Pzizer CEO Over Vaccine Efficacy
137K258 -
 14:53
14:53
Stephen Gardner
8 hours ago🔥Alex Jones WARNS Trump not to DEFAULT on THIS!!
68.8K339 -
 31:54
31:54
The Why Files
5 days agoThe Quantum Apocalypse: All Your Secrets Revealed
122K60 -
 7:05:17
Sgt Wilky Plays
11 hours agoSaturday Hangout and Games
73K4 -
 8:23:23
DeadMan88
13 hours agoWGT Golf Road to Master
45.3K5 -
 1:35:04
Winston Marshall
2 days ago“This Wasn’t Accidental!” Maajid Nawaz SPEAKS OUT on R*PE Gangs and The REAL Cover-Up
121K67