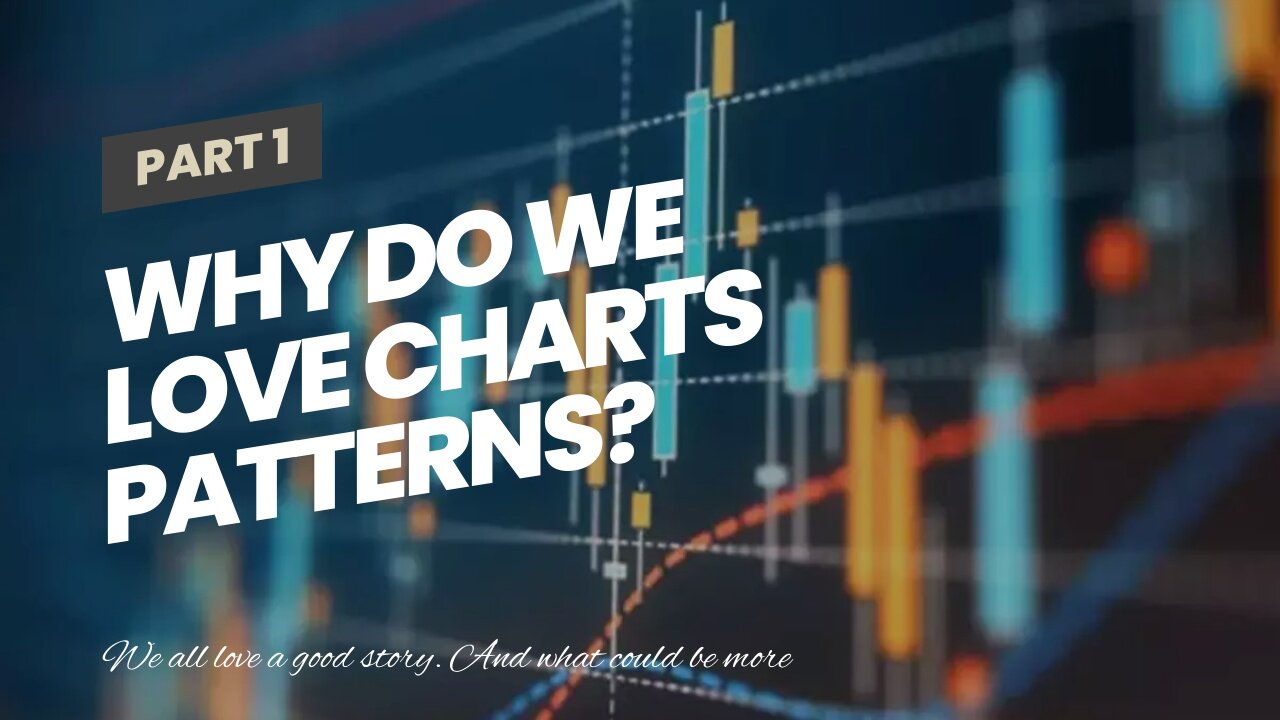
Why Do We Love Charts Patterns?
Why Do We Love Charts Patterns?
We all love a good story. And what could be more satisfying than finding a simple, elegant explanation for the complex ebb and flow of the markets? That’s where chart patterns come in.
For the uninitiated, chart patterns are simply recurring shapes that form on price charts. They can be anything from simple head-and-shoulders formations to more esoteric Elliott Wave patterns. But whatever their form, they all promise to give us a glimpse into the future direction of prices.
The appeal of chart patterns is understandable. They offer the tantalizing prospect of being able to predict market moves with a...
https://finetimer.site/why-do-we-love-charts-patterns/
We all love a good story. And what could be more satisfying than finding a simple, elegant explanation for the complex ebb and flow of the markets? That’s where chart patterns come in.
For the uninitiated, chart patterns are simply recurring shapes that form on price charts. They can be anything from simple head-and-shoulders formations to more esoteric Elliott Wave patterns. But whatever their form, they all promise to give us a glimpse into the future direction of prices.
The appeal of chart patterns is understandable. They offer the tantalizing prospect of being able to predict market moves with a high degree of accuracy. And in a world where uncertainty is the norm, that is a very seductive proposition indeed.
But as any experienced trader will tell you, chart patterns are also fraught with danger. The risk of confirmation bias is ever present, as is the trap of overfitting data to suit our preconceptions. And then there are the pitfalls of hope and greed that can lead even the most disciplined trader astray.
So, if you’re thinking of using chart patterns to guide your trading decisions, here are three things you need to know… Photo by cottonbro studio on Pexels The allure of charts patterns.
The siren song of simplicity.
We love charts patterns because they offer a glimpse of order in the chaos of the markets. They are simple and elegant, and they can be easy to learn and trade. But there is also a dark side to chart patterns. They can be misleading, and even dangerous. In this article, we’ll explore both the allure and the dangers of chart patterns, and discuss how to find success with them.
The appeal of order.
The markets are inherently chaotic and unpredictable. This can be frustrating for traders who crave certainty and order. Chart patterns offer a way to find order in the markets. They provide clear entry and exit points, and defined risk levels. This can be very appealing to traders who want to take control of their trading decisions.
The seduction of certainty.
Of course, no one can predict the future with 100% accuracy. But chart patterns can give us a false sense of certainty about where the markets are headed next. We start to believe that we have found the “holy grail” of trading, when in reality we are just seeing what we want to see. This can lead to big losses if we’re not careful.
The danger of chart patterns.
The risk of confirmation bias.
One of the dangers of chart patterns is confirmation bias. This is when traders only look for evidence that confirms their beliefs, while ignoring evidence to the contrary. For example, a trader who believes that a stock is going to go up might only look at charts that show the stock going up, and ignore charts that show the stock going down. This can lead to bad decision-making, as the trader is not considering all of the available evidence.
The trap of overfitting.
Another danger of chart patterns is overfitting. This is when traders try to fit too much data into a pattern, or when they try to force a pattern where one does not exist. For example, a trader might look at a chart and see what looks like a head and shoulders pattern forming. However, if they zoom in too close, they might realize that there are actually two different head and shoulders patterns forming at the same time, one on top of the other. This can lead to false signals and poor trading decisions.
The pitfalls of hope.
Lastly, another danger of chart patterns is the pitfall of hope. This is when traders believe that just because a pattern exists, it will always work out in their favor. For example, a trader might see a head and shoulders pattern forming on a chart and buy the stock thinking that it will go up soon. However, sometimes these patterns can take months or even years to play out, and in t...
-
 6:21
6:21
FineTimer
2 years agoHuobi Global: How to Get Ahead in the Digital World
4051 -
 9:06
9:06
Colion Noir
10 hours agoKid With Gun Shoots & Kills 2 Armed Robbers During Home Invasion
4.52K2 -
 54:28
54:28
LFA TV
1 day agoUnjust Man | TRUMPET DAILY 2.27.25 7PM
9.06K2 -
 DVR
DVR
CatfishedOnline
6 hours ago $0.53 earnedGoing Live With Allen Weekly Recap
10.8K -
 20:10
20:10
CartierFamily
7 hours agoAndrew Schulz DESTROYS Charlamagne’s WOKE Meltdown on DOGE & Elon Musk!
26K45 -
 1:36:39
Redacted News
4 hours agoBOMBSHELL EPSTEIN SH*T SHOW JUST DROPPED ON WASHINGTON, WHAT IS THIS? | Redacted w Clayton Morris
129K224 -
 2:03:31
Revenge of the Cis
6 hours agoEpisode 1453: Fat & Fit
39.8K7 -
 2:38:12
The White House
7 hours agoPresident Trump Holds a Press Conference with Prime Minister Keir Starmer of the United Kingdom
141K59 -
 1:01:04
In The Litter Box w/ Jewels & Catturd
1 day agoDrain the Swamp! | In the Litter Box w/ Jewels & Catturd – Ep. 751 – 2/27/2025
84.9K35 -
 1:11:24
Dr. Drew
7 hours agoNEW: Cardiac Arrest In Healthy Young People After mRNA w/ Nicolas Hulscher – Ask Dr. Drew
67.9K30