Premium Only Content

2 Pharmacodynamics Dose Response Relationship
Regardless of how a drug effect occurs—through binding or chemical interaction—the concentration of the drug at the site of action controls the effect. However, response to concentration may be complex and is often nonlinear. The relationship between the drug dose, regardless of route used, and the drug concentration at the cellular level is even more complex (see Pharmacokinetics).
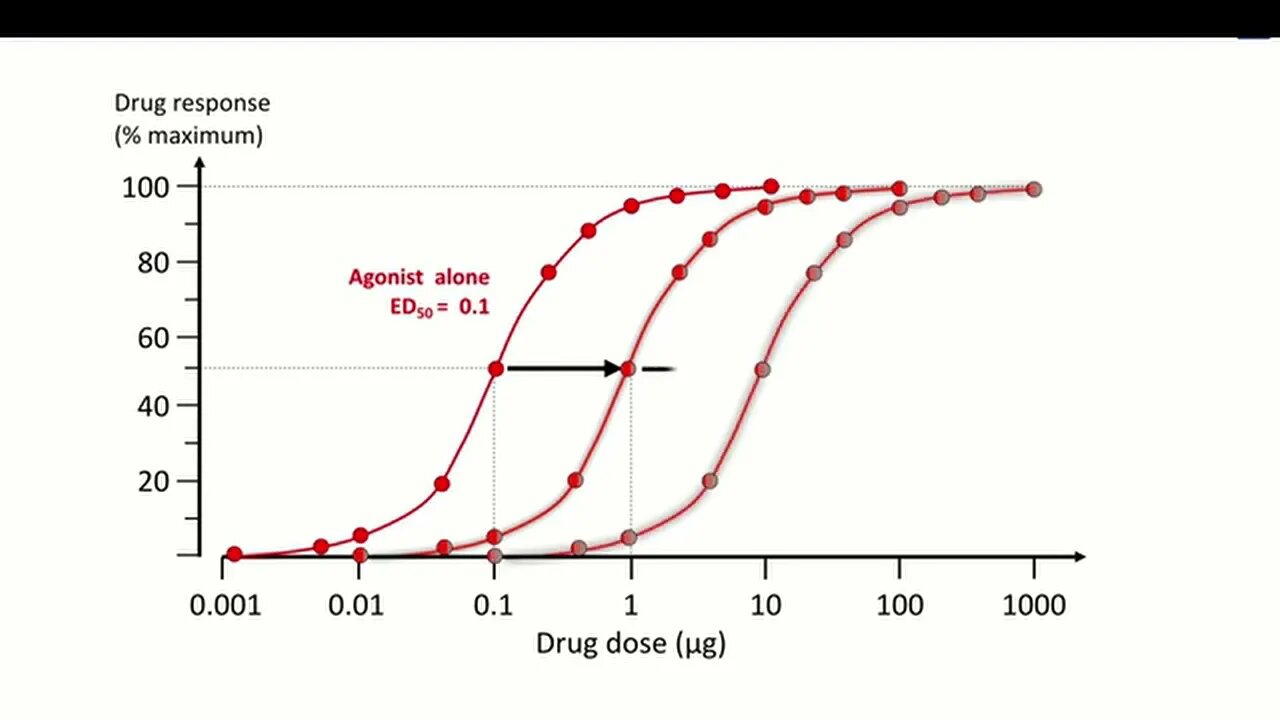
Dose-response data are typically graphed with the dose or dose function (eg, log10 dose) on the x-axis and the measured effect (response) on the y-axis. Because a drug effect is a function of dose and time, such a graph depicts the dose-response relationship independent of time. Measured effects are frequently recorded as maximal at time of peak effect or under steady-state conditions (eg, during continuous IV infusion). Drug effects may be quantified at the level of molecule, cell, tissue, organ, organ system, or organism.
A hypothetical dose-response curve has features that vary (see figure Hypothetical dose-response curve):
Potency (location of curve along the dose axis)
Maximal efficacy or ceiling effect (greatest attainable response)
Slope (change in response per unit dose)
-
 LIVE
LIVE
Kim Iversen
4 hours agoLuigi Mangione Charged With TERRORISM | Liz Cheney Accused Of WITNESS TAMPERING, Faces 20 YEARS IN JAIL
2,944 watching -
 LIVE
LIVE
Akademiks
5 hours agoJay Z says he aint NEVER been friends w/ DIDDY! Bhad Bhabie lost her man? Travis Hunter Down Bad?
4,350 watching -
 2:27:04
AirCondaTv Gaming
3 hours ago $2.69 earnedWar Thunder - Tankering Around for That 10 Bomb
15.5K4 -
 4:19:05
SpartakusLIVE
6 hours agoThe MACHINE locks in for 12-hour POWER stream
12.1K1 -
 1:58:40
Robert Gouveia
5 hours agoJ6 Coverup: Prosecute LIZ CHENEY; NY Judge REJECTS Immunity; Trump Breaks Gag?
50.7K38 -
 2:22:06
WeAreChange
4 hours agoPSYOP Spreads: Drones Shut Down Airport In New York!
39.5K14 -
 1:31:18
Redacted News
6 hours agoEMERGENCY! NATO AND CIA ASSASSINATE TOP RUSSIAN GENERAL, PUTIN VOWS IMMEDIATE RETALIATION | Redacted
183K241 -
 56:45
56:45
VSiNLive
5 hours ago $4.64 earnedFollow the Money with Mitch Moss & Pauly Howard | Hour 1
51.6K2 -
 52:44
52:44
Candace Show Podcast
5 hours agoMy Conversation with Only Fans Model Lilly Phillips | Candace Ep 122
63K240 -
 UPCOMING
tacetmort3m
6 hours ago🔴 LIVE - RELIC HUNTING CONTINUES - INDIANA JONES AND THE GREAT CIRCLE - PART 5
30.2K