Monthly Profit and Loss Analysis using Graph Chart PowerPoint Template
2 years ago
2
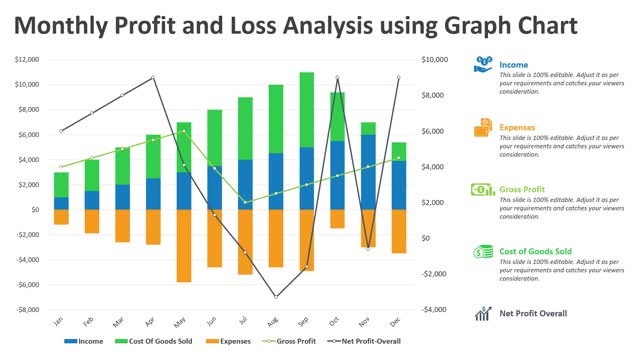
Use this monthly profit and loss analysis using graph chart PowerPoint template to summarize a company’s revenues, expenses, profits, and losses. You can also use this PPT template to make a financial statement over a given period of time. Explore now: https://bit.ly/3CbjkUG
Loading comments...
-
 4:31:10
I_Came_With_Fire_Podcast
23 hours agoMy EURO Divorce | HOGG with a side of PAC | Foreign FUNDS Fudged
67.1K9 -
 37:44
37:44
Glenn Greenwald
20 hours agoGlenn On Tearing Down the Military Industrial Complex, Exposing Pro-Israel Indoctrination, and More | SYSTEM UPDATE #411
146K206 -
 4:04:20
Nerdrotic
19 hours ago $58.85 earnedAmazon Takes 007! Hollywood is Lost, Disney Cancels WHO? | Friday Night Tights 342 /w ItsAGundam
202K58 -
 43:27
43:27
Tucker Carlson
18 hours agoRay Dalio: America’s Hidden Civil War, and the Race to Beat China in Tech, Economics, and Academia
234K239 -
 56:56
56:56
Candace Show Podcast
18 hours agoEXCLUSIVE: Taylor Swift Will Be Deposed. | Candace Ep 150
259K205 -
 1:03:52
IsaacButterfield
15 hours ago $11.44 earnedRepublican Vs 25 Transgender Activists | Jewish Outrage | Lizzo Loses All the Weight
92.6K32 -
 1:10:23
Edge of Wonder
19 hours agoChinese Biochips Hacking Minds? Quantum Control & Journey Song Mandela Effect
106K9 -
 2:15:46
Quite Frankly
22 hours ago"Ghosts, Robotics, and OBE's" ft. Dr. Albert Taylor 2/21/25
93.5K20 -
 55:52
55:52
LFA TV
1 day agoMaking Germany Great Again | TRUMPET DAILY 2.21.25 7PM
63.2K17 -
 1:52:26
2 MIKES LIVE
18 hours ago2 MIKES LIVE #183 Open Mike Friday with Hannah Faulkner and Adelia Kirchner!
46.5K1