Premium Only Content
This video is only available to Rumble Premium subscribers. Subscribe to
enjoy exclusive content and ad-free viewing.

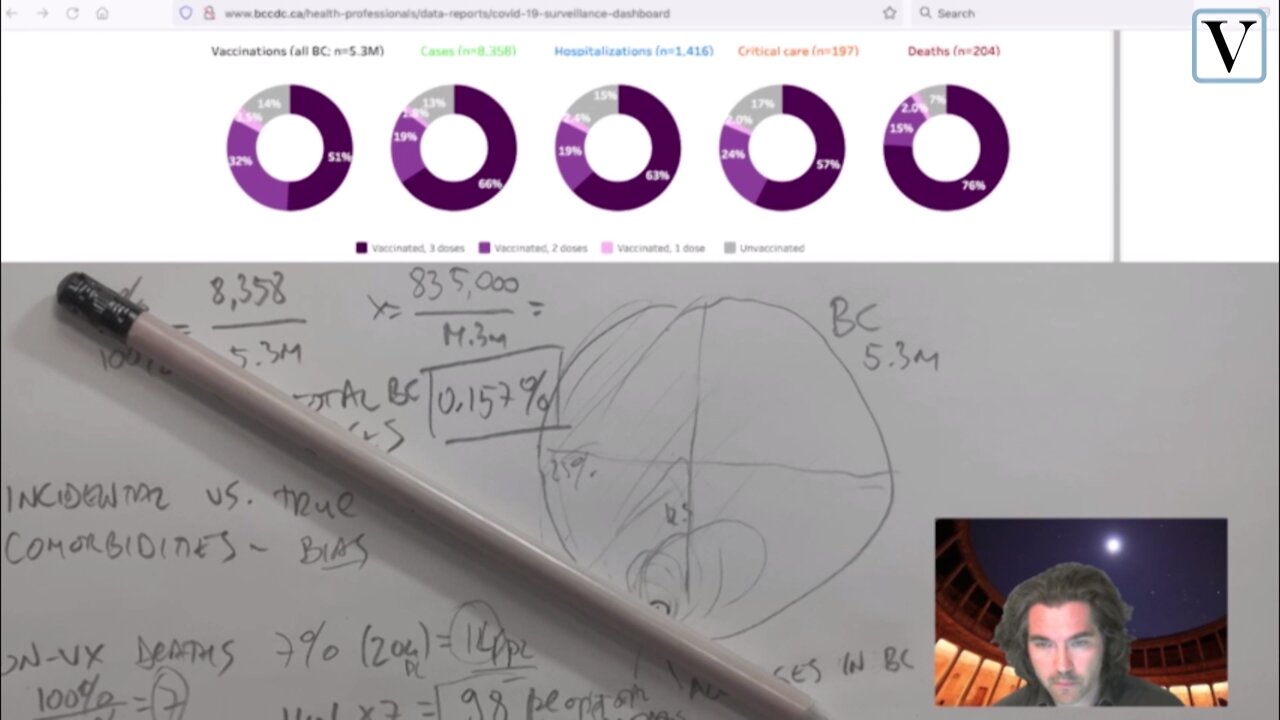
Exploring the Control Group in BC Released Data
2 years ago
6
1:03 - Putting the charts in perspective
5:52 - Deriving results from the Control Group - "worst case scenario".
The link to this official BC data (May 2022):
http://www.bccdc.ca/health-professionals/data-reports/covid-19-surveillance-dashboard
NOTE: 14% (out of 5.3M people) = 742,000 people (from first, far left chart) - large control group size indeed.
ALSO NOTE: The case number percentage ought to be calculated over the number of individuals tested, rather than the entire population. Consequently the percentage of cases in BC would be a larger number. I didn't manage to find the number of tests done in the month of April in BC to update that equation's result.
Thanks for the feedback everyone.
Loading comments...
-
 58:44
58:44
Flyover Conservatives
1 day agoInauguration Danger: Is Trump Walking Into a Trap? - Sheriff Richard Mack | FOC Show
41.6K16 -
 1:48:50
Precision Rifle Network
1 day agoS4E1 - Guns & Grub - Back like a bad rash!
69.5K5 -
 1:11:22
Common Threads
10 hours ago $6.06 earnedLIVE DEBATE: Trump Pushes U.S. Expansion, Cali Fires Spark Political Outrage
72.1K7 -
 54:46
54:46
LFA TV
14 hours agoThe LA Apocalypse | TRUMPET DAILY 1.9.25 7pm
60.9K39 -
 57:50
57:50
theDaily302
19 hours agoThe Daily 302-CORY GAUTEREAUX
61.9K -
 9:49
9:49
Tundra Tactical
9 hours ago $2.76 earnedISIS ATTACK Screams Incompetence.
49K3 -
 47:51
47:51
Anthony Pompliano
1 day ago $9.48 earnedRegulators Tried To End Bitcoin?!
79.8K11 -
 8:39:59
BSparksGaming
14 hours agoMarvel Rivals Season 1 is ALMOST HERE! Time to Grind!
66.8K2 -
 45:26
45:26
Kimberly Guilfoyle
13 hours agoBreaking News Coverage of LA Fires, Live with Asm Bill Essayli & Jennifer Kelly | Ep. 187
67.9K103 -
 1:36:05
Redacted News
12 hours agoBREAKING! Trump Slams Communist California Dems over Wildfire Disaster | Redacted News
145K340