Information cannot be judged without understanding the meaning of the scale
2 years ago
6.96K
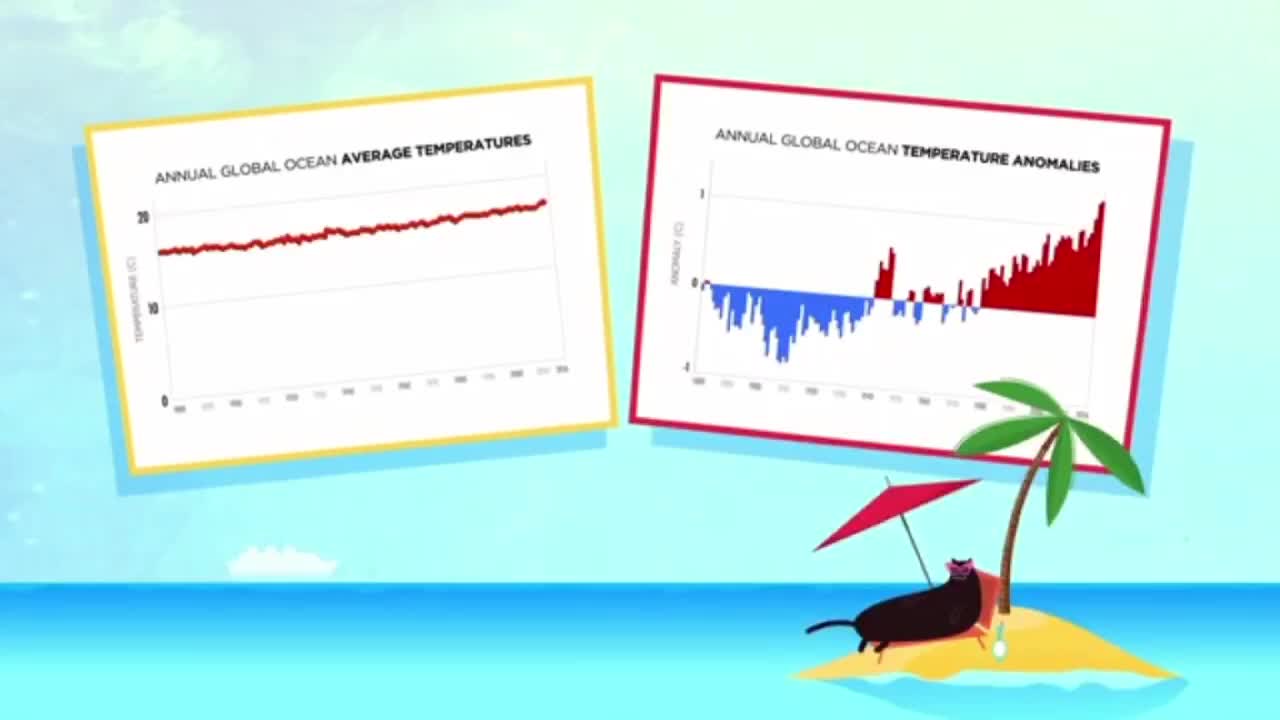
Finally, a graph can't tell you much if you don't know the full significance of what's being presented.Both of the following graphs use the same ocean temperature data from the National Centers for Environmental Information.So why do they seem to give opposite impressions?The first graph plots the average annual ocean temperature from 1880 to 2016,making the change look insignificant.But in fact, a rise of even half a degree Celsius can cause massive ecological disruption.This is why the second graph,which show the average temperature variation each year,is far more significant.
Loading comments...
-
 45:56
45:56
Glenn Greenwald
10 hours agoLee Fang Reacts to Trump's Speech to Congress; Will DOGE Tackle Military Waste? | SYSTEM UPDATE #418
111K96 -
 43:23
43:23
Donald Trump Jr.
10 hours agoNo Clap: Dems are a Disgrace but My Father is Bringing Back Common Sense | Triggered Ep.222
156K126 -
 18:29
18:29
The Rad Factory
1 day ago $3.24 earnedBuilding Shred Eighty a Custom Honda Snow Kart
47.2K6 -
 UPCOMING
Precision Rifle Network
1 day agoS4E7 Guns & Grub - What makes group size increase?
31.9K2 -
 46:29
46:29
SGT Report
1 day agoAMERICA IS BACK! BYE BYE IRS!! -- Sam Anthony
74.2K97 -
 8:56:13
Dr Disrespect
17 hours ago🔴LIVE - DR DISRESPECT - WARZONE - 150 PLAYER LOBBIES
187K20 -
 1:27:35
Redacted News
11 hours ago"This is NOT normal" Trump just destroyed the woke mob as Dems in disarray | Redacted News Live
171K299 -
 1:39:52
Vigilant News Network
12 hours agoUNHINGED: Dems Say That Elon Needs to ‘Go Back to AFRICA?’ | The Daily Dose
108K25 -
 1:13:13
Sean Unpaved
12 hours ago $7.41 earnedQB Carousel with Guest Coach Herm Edwards
90K3 -
 1:04:28
Crypto Power Hour
1 day ago $6.28 earnedThe Crypto Power Hour - ‘In Crypto We Trust’
86.8K8