Premium Only Content
This video is only available to Rumble Premium subscribers. Subscribe to
enjoy exclusive content and ad-free viewing.

Advertising exaggerates the gap by reducing the proportion
Repost
2 years ago
13.7K
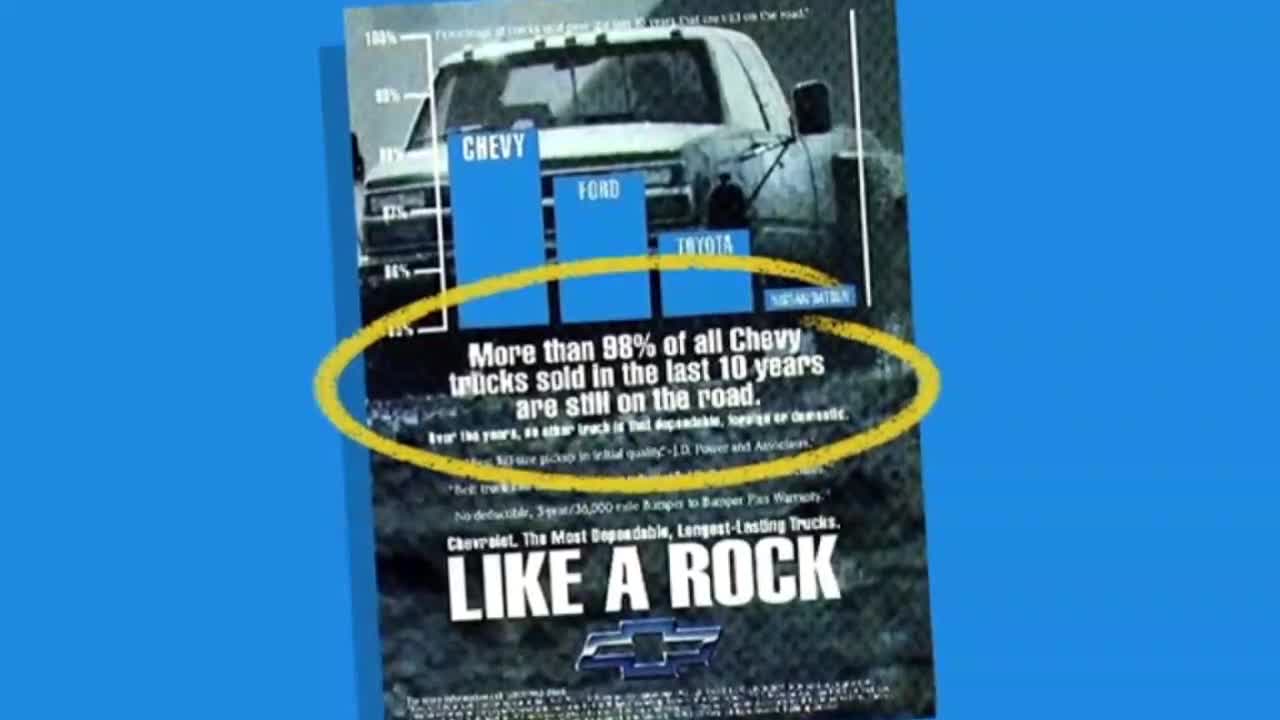
Yet, as it turns out, there are plenty of ways graphs can mislead and outright manipulate.Here are some things to look out for.In this 1992 ad, Chevy claimed to make the most reliable trucks in America using this graph.Not only does it show that 98% of all Chevy trucks sold in the last ten years are still on the road,but it looks like they're twice as dependable as Toyota trucks.That is, until you take a closer look at the numbers on the left and see that the figure for Toyota is about 96.5%.The scale only goes between 95 and 100%.If it went from 0 to 100,it would look like this.
Loading comments...
-
 1:42:21
The Quartering
13 hours agoTrump To INVADE Mexico, Take Back Panama Canal Too! NYC Human Torch & Matt Gaetz Report Drops!
133K99 -
 2:23:15
Nerdrotic
12 hours ago $12.27 earnedA Very Merry Christmas | FNT Square Up - Nerdrotic Nooner 453
103K11 -
 1:14:05
Tucker Carlson
12 hours ago“I’ll Win With or Without You,” Teamsters Union President Reveals Kamala Harris’s Famous Last Words
195K361 -
 1:58:31
The Dilley Show
12 hours ago $33.68 earnedTrump Conquering Western Hemisphere? w/Author Brenden Dilley 12/23/2024
149K40 -
 1:09:59
Geeks + Gamers
13 hours agoSonic 3 DESTROYS Mufasa And Disney, Naughty Dog Actress SLAMS Gamers Over Intergalactic
101K21 -
 51:59
51:59
The Dan Bongino Show
14 hours agoDemocrat Donor Admits The Scary Truth (Ep. 2393) - 12/23/2024
890K2.98K -
 2:32:15
Matt Kohrs
1 day agoRumble CEO Chris Pavlovski Talks $775M Tether Partnership || The MK Show
134K34 -
 28:23
28:23
Dave Portnoy
1 day agoDavey Day Trader Presented by Kraken - December 23, 2024
165K44 -
 59:29
59:29
BonginoReport
16 hours agoTrump, Murder Plots, and the Christmas Miracle: Evita + Jack Posobiec (Ep.110) - 12/23/2024
169K147 -
 2:59:14
Wendy Bell Radio
19 hours agoNothing To See Here
134K80