Premium Only Content

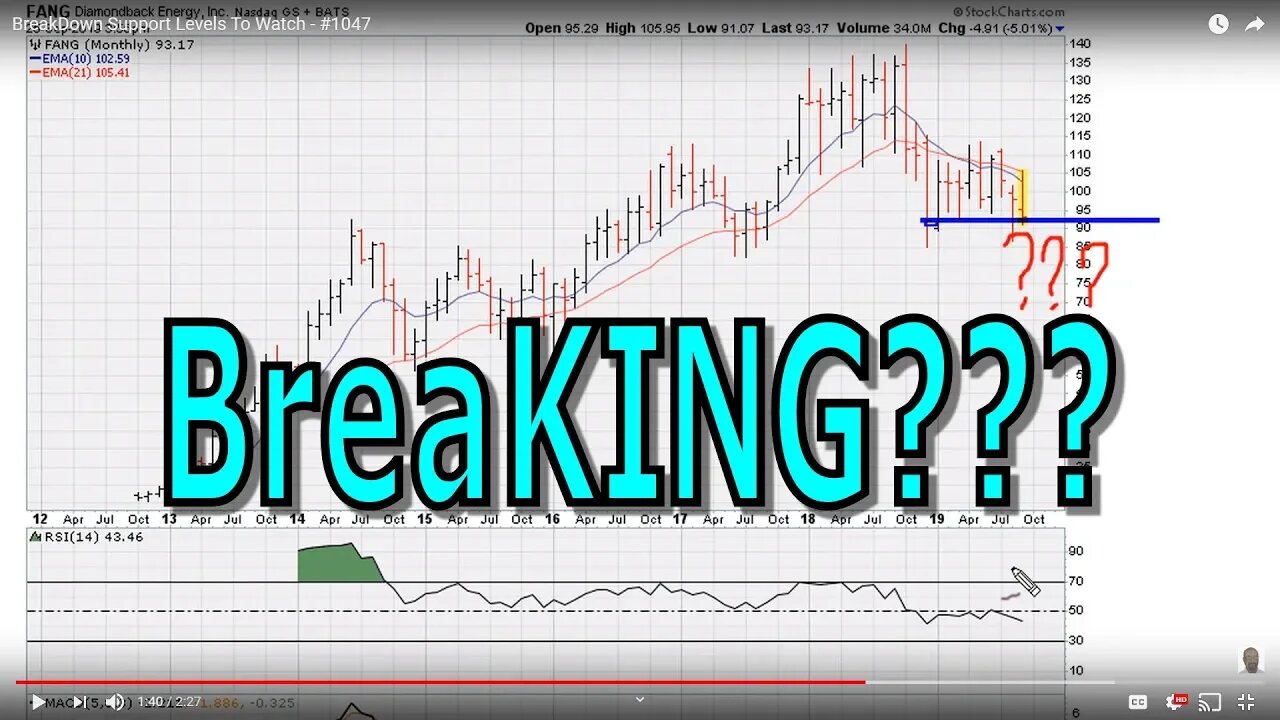
BreakDown Support Levels To Watch - #1047
Beyond The Recent Price Range - #1046
https://youtu.be/BogvZ0cHBYI
4000+ Videos Later...
https://youtu.be/Kn-yiytg-OM
Based mostly on Original Muathe.com Concepts. Bang!
LIKE | COMMENT | SHARE | SUBSCRIBE
A http://muathe.com/ Original Concept!
Using Mostly Original http://muathe.com/ Concepts!
Watching Potential Price Break Down Levels - #1039
https://youtu.be/S4sKy3gA9cI
The Meat - Beyond Previous Indicator Lows - #1007
https://youtu.be/tk42-jvl_1o
Follow up below... We look at the consequences of RSI negative divergence, failed RSI 69.1 rejection levels -especially when done with uniform activity.
Sell Flags! When To Sell Stocks - #973
https://www.youtube.com/watch?v=ohwW0EmvyAg
Uniformity and Negative Divergence - #732
https://youtu.be/yC12pP0oPjQ
"Single RSI Long-Term Lines"
https://www.youtube.com/playlist?list=PLjHhEQ5LDpkbdDw1HvcyDOLq7EgGWzXXF
Stock Charts RSI 30 Level & RSI 70 Level Explained
https://www.youtube.com/playlist?list=PLjHhEQ5LDpkaILP62YdqCXyHmndnhU4u1
Check out this video on phi or golden mean or 1.618 https://www.youtube.com/watch?v=fvdmISdytXg
Uniformity and Negative Divergence - #732
https://youtu.be/yC12pP0oPjQ
There is a need to extend major RSI trend lines since they do offer some hidden signals down the road. Here is a good example.
We look at how to draw simple lines on the RSI to determine where the odds of price movement seem to be pointing to.
And don't forget to account to uniform or symmetric RSI support or rejection on any previously important RSI line as per the instrument's own trading history.
"Daily 2-Minute Chart Study #350: The 27 Year Old - Sentiment - Memory Line"
https://youtu.be/XYxf4hnJJqU
"Uniformity"
https://www.youtube.com/playlist?list=PLjHhEQ5LDpkZnwHCqMVKNLu0n0YTffk66
"RSI Divergence 2.0 & Uniformity"
https://www.youtube.com/playlist?list=PLjHhEQ5LDpkb8JhsWT166IiNBFtZMJwLn
"RSI 50 Level Uniform Support or Rejection "
https://www.youtube.com/playlist?list=PLjHhEQ5LDpkZy6WqgZkBGhDt-LzoRDvYT
RSI 50 crossing, sell signals, uniformity, single line, 30.9, 69.1, worst type of negative divergence.
$BYND $VTI $IWM $IWC $SPSM $IWO $AAPL $QQQ $TQQQ $SPY $IVV $VUG $XLK $IVE $IWF $XLK $TNAV $VXX $EEM $VTI $IWM $IWC $SPSM $XLF $IYR $XLE
BYND Pending
-
 2:31
2:31
Muathe.com
1 year ago $0.01 earned🟢 Manipulated Stock Market Bubbles & Crashes!?
121 -
 LIVE
LIVE
vivafrei
8 hours agoEp. 237: More Trump Cabinet Picks! MAHA or Slap in the Face? Canada on Fire! Go Woke Go Broke & MORE
21,515 watching -
 LIVE
LIVE
Vigilant News Network
2 hours agoCOVID-Vaccinated Hit With Grave New Reality | Media Blackout
1,918 watching -
 19:30
19:30
DeVory Darkins
7 hours ago $22.69 earnedJoe Rogan MOCKS The View as Bill Maher HUMILIATES Woke Scientist
53.8K47 -
 LIVE
LIVE
Scottish Viking Gaming
9 hours ago🔴LIVE | SUNDAY FUNDAY | Jump into my Sons of the Forest Game | DOO EET NOWWA!
1,071 watching -
 24:01
24:01
Winston Marshall
4 days agoThe TRUTH About The UK Farmer Protest What No One Is Talking About...
60K150 -
 3:21:56
Tate Speech by Andrew Tate
13 hours agoEMERGENCY MEETING EPISODE 93 - ME TOO!
224K149 -
 3:21:42
FRENCHY4185
8 hours agoPRESTIGE AND CAMO GRIND : BLACK OPS 6
56.6K2 -
 1:29:47
Real Coffee With Scott Adams
9 hours agoEpisode 2669 CWSA 11/24/24
87.7K29 -
 13:52
13:52
Hershberger's Kitchen
20 hours agoTwo Delicious Dip and Spread Recipes to Try, Inspirational Thought
77.6K5