Microsoft Excel Visio Data Visualizer Add In for Excel: My Review
FREE EXCEL VISIO DATA VISUALIZER GUIDE: https://excel.tv/microsoft-excel-visio-data-visualizer-add-in-for-excel-a-quick-guide/
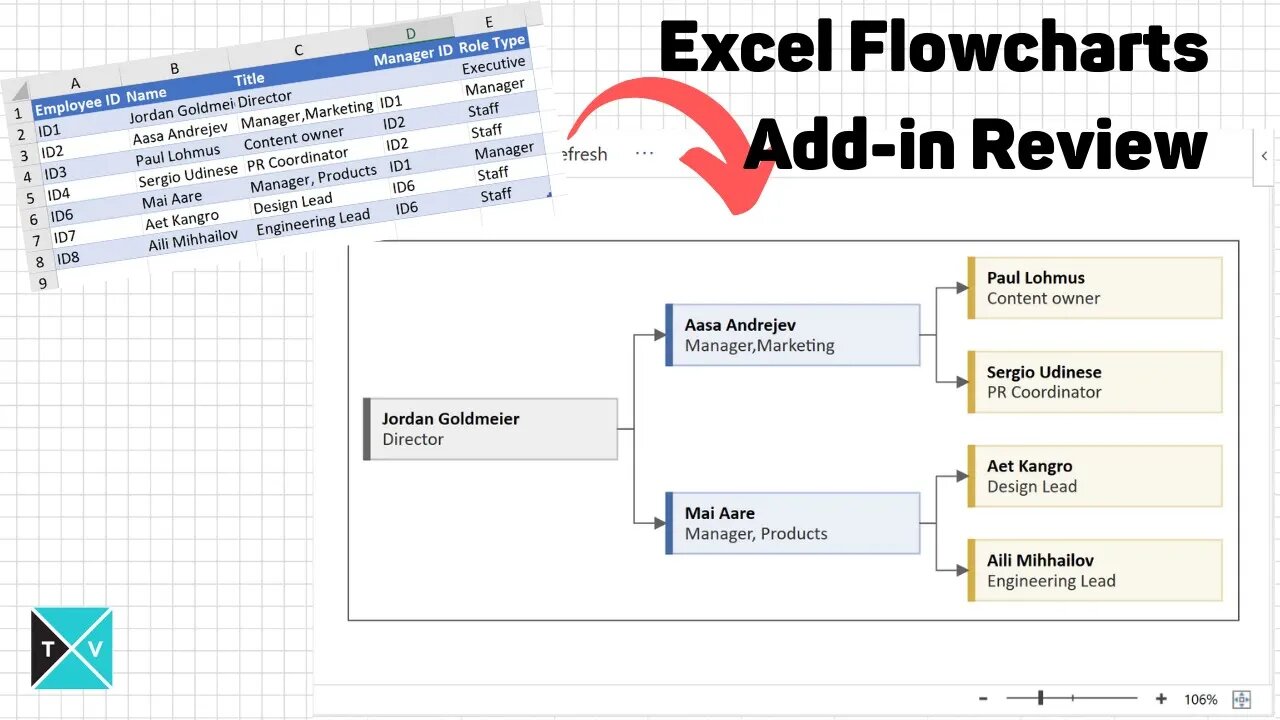
I wanted to let you know about a really cool new add in for Microsoft Excel. This is one of those modern add-ins you can download from the Microsoft store.
This add-in can allow you to easily create hierarchy type process maps and flow charts. The free version creates standalone type charts. The paid version, the one Microsoft would like you to buy, connects you to the online Visio service. The idea is that you can create a process map in Excel, automatically generate an editable Visio file, and then integrate that into Power Point.
Today, I'll only deal with the *FREE* version.
How to install the Microsoft Excel Data Visualizer
You can install Data Visualizer to your Office 365 installation. Go to Insert / Get Add Ins. Search for "data visualizer." When you see the Microsoft Excel Data Visualizer tool, select Add. Once installed, you'll need to login with your Office 365 Account to gain access.
To insert a new diagram, go Insert / My Add-ins and select My Add-ins / Microsoft Data Visualizer.
Diagram Types
The are three diagram types available. These types are as follows: Basic Flow Chart, Cross-Functional Flowchart, and Organization Chart.
Cross Functional Flow Charts
There are five default flowchart types for Cross Functional charts. Sometimes these are referred to as "swim lane" charts. Here are the defaults:
Organization Chart
There are five organizational chart types. These charts create hierarchies useful for modeling organizational structures. However, with some additional work, you could adapt the problem to alternate hierarchies.
Editing a Hierarchy
I won't go through each type in this guide. However, no matter which type you select, several options are available in each diagram type by editing the Excel table.
For the most part, you can edit the following parts of the diagrams: Connections to other Objects, Captions, Object Shape and Color, and Connection Labels.
Editing a Caption
Each diagram allows you to edit one or more captions. In the hierarchy example, you can edit each title by changing the Process Step Description. Again, this column name might change depending upon the chart type selected, but it should be fairly obvious which column holds the information.
Editing an Object Shape and Color
Most diagram options will have a preloaded set of categorical designations. These will change the color and shape of each object. I think some of them follow flow chart norms.
Editing a Connection Label
You can also edit a connection label in several charts. This will allow you to change the label next to the connection arrow to the next job. If you think of a decision flow diagram, the standard connection labels for a decision are "Yes, No." You'll see columns like Connector Label that will allow you to set the label. If you have multiple connections separated by a comma, each comma separated label will be applied to them respectively. (You can see an example of this in the video above.)
Overview of the Visio Flow Chart
This section provides an over view of the actual flow chart. There are multiple buttons on and interactive items on the chart. The image below provides a description of the layout.
Note that you can edit, refresh, change the zoom level and view expanded options.
Edit Button
This button is a bit of a misnomer as you are able to edit the chart on the spreadsheet itself. However, if you have one of those expanded Office 365 licenses (don't ask me which one, I can barely figure out my current license -- all I know is that it doesn't include Visio), you can actually edi the the file itself as a visio file. That would give you significantly more control over color, fonts, and more.
Refresh Button
After each change to the Excel table, you'll need to hit Refresh to see the result. I'm told this will be upgraded to automatically refresh. Until the, you'll be clicking this button a lot.
Zooming
You can zoom in and out using the zoom slider. If you want to reset the zoom, you can select the zoom to fit button.
Expanded Options (Delete Button)
The expanded options menu contains additional support items. It's also where you can delete the visio chart if you don't want it anymore. You can also show it as a saved image.
-
 DVR
DVR
Bannons War Room
10 days agoWarRoom Live
2.58M435 -
 16:06
16:06
The Rubin Report
7 hours agoProof the Islamist Threat in England Can No Longer Be Ignored | Winston Marshall
34.3K24 -
 2:07:07
Robert Gouveia
4 hours agoFBI Files Coverup! Bondi FURIOUS; SCOTUS Stops Judge; Special Counsel; FBI Does
40.5K32 -
 56:15
56:15
Candace Show Podcast
5 hours agoBREAKING: My FIRST Prison Phone Call With Harvey Weinstein | Candace Ep 153
107K69 -
 LIVE
LIVE
megimu32
1 hour agoON THE SUBJECT: The Epstein List & Disney Channel Original Movies Nostalgia!!
178 watching -
 9:06
9:06
Colion Noir
10 hours agoKid With Gun Shoots & Kills 2 Armed Robbers During Home Invasion
16.9K3 -
 54:28
54:28
LFA TV
1 day agoUnjust Man | TRUMPET DAILY 2.27.25 7PM
19.7K2 -
 DVR
DVR
CatfishedOnline
7 hours ago $1.19 earnedGoing Live With Allen Weekly Recap
21.8K -
 20:10
20:10
CartierFamily
7 hours agoAndrew Schulz DESTROYS Charlamagne’s WOKE Meltdown on DOGE & Elon Musk!
36.8K45 -
 1:36:39
Redacted News
5 hours agoBOMBSHELL EPSTEIN SH*T SHOW JUST DROPPED ON WASHINGTON, WHAT IS THIS? | Redacted w Clayton Morris
145K242