Premium Only Content

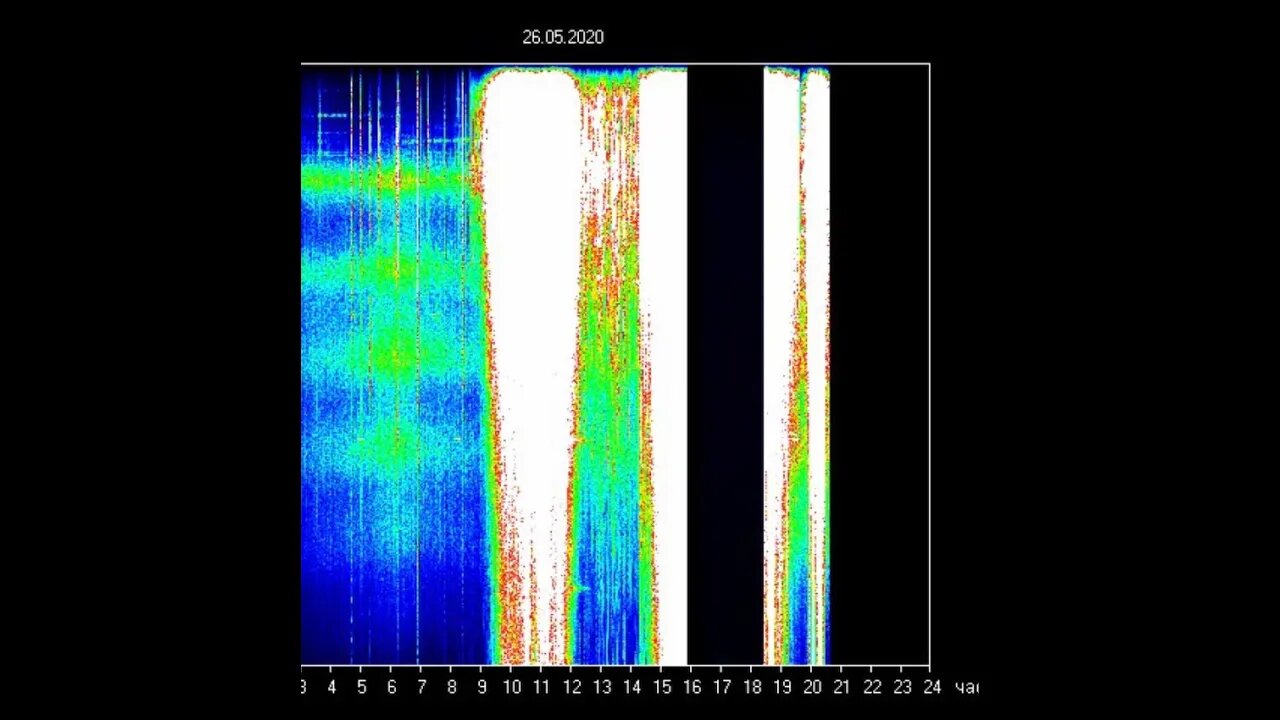
Schumann Resonance Amplitude Spike, Finger of God, No Data, Energy Between Spikes
Schumann Resonance - May 26, 2020 - Amplitudes spiking, Finger of God, Bedrock, Solar Flares influence, Effects on Human Energy Field
Interpretation by Susan Inspired
- Finger of God image
- Amplitude peaks - 72 for Resonance #1 (White)
- The energy between the two spikes
- Other images: green circles, vertice point at ~8
- No data for 2 hours - the importance of ‘two hours’
Please help me make these videos - Paypal.Me: https://paypal.me/SusanInspired?locale.x=en_US Gratitude 🙏
Links -
Schumann Resonance - Finger of God video
https://youtu.be/OvuBsWyViDw
- The Finger of God image in the Schumann data chart
- How the aspects of the chart came together to create this image and my interpretation of what it means and how this energy interacts with our human energy field
Schumann Resonance - No Data What Does it Mean?
https://youtu.be/ZdqQDZeD4ko
Date Range: May 24-26, 2020
Data Source: Schumann Resonance data from Space Observing System, Tomsk, Ru. Solar Flares from Tesis Laboratory of X-Ray Astronomy of the Sun.
Please sign up for my newsletter here - I do a monthly email summarizing my content, plus announcements of courses or events.
http://eepurl.com/cqQ_mH
Check out my blog and more information here:
https://bit.ly/2Qw8Q9F
Video audio and typed notes © 2020 Susan Inspired. All Rights Reserved. Permission is given to share this video on other blogs and websites as long as the author’s credit and live link back to this channel and/or my blog are included.
Thank you for sharing!
May 26 2020
-
 57:03
57:03
Flyover Conservatives
22 hours agoJack Hibbs Blasts California Leaders: Must-Watch!; Can Trump Fix the Mess? How Long will it Take? - Dr. Kirk Elliott | FOC Show
20.5K2 -
 2:00:50
DillyDillerson
2 hours agoTalking to the moon!! Just some live views of the FULL MOON!!
12.7K7 -
 1:29:29
Glenn Greenwald
6 hours agoWith Biden Out, U.S. Finally Admits Harms of His Israel / Gaza Policy; Biden Pays Homage To George W. Bush; Insane Women’s Tennis Scandal: An “Abusive” Coach | SYSTEM UPDATE #388
47.7K48 -
 LIVE
LIVE
Danny Polishchuk
9 hours agoWho's To Blame For LA Fires, Jewish Tunnels Update + Forbidden Anthropology
408 watching -
 1:08:10
Donald Trump Jr.
8 hours agoOne Week Until Inauguration, Live with Rep Anna Paulina Luna & Sen Tommy Tuberville
116K164 -
 1:00:13
The StoneZONE with Roger Stone
5 hours agoLAWFARE! Are Trump's Legal Assaults Winding Down? w/ Impeachment Lawyer David Schoen | The StoneZONE
30K -
 1:01:43
Patriots With Grit
23 hours agoShocking Changes Are Coming-7 ‘Mission Critical’ Steps Soon To Be Released That Will Leave You Speechless! | John Richardson
12.8K1 -
 8:00:59
Dr Disrespect
12 hours ago🔴LIVE - DR DISRESPECT - MARVEL RIVALS - TOP 500 IN THE WORLD
154K28 -
 54:46
54:46
LFA TV
1 day agoThe Soon-Coming Social Millennium | TRUMPET DAILY 1.13.25 7pm
28.1K2 -
 1:00:03
Sarah Westall
4 hours agoWeaponized Chaos – Worst in Modern History; Changing Geopolitical Landscape w/ Andy Schectman
24.1K5