Premium Only Content

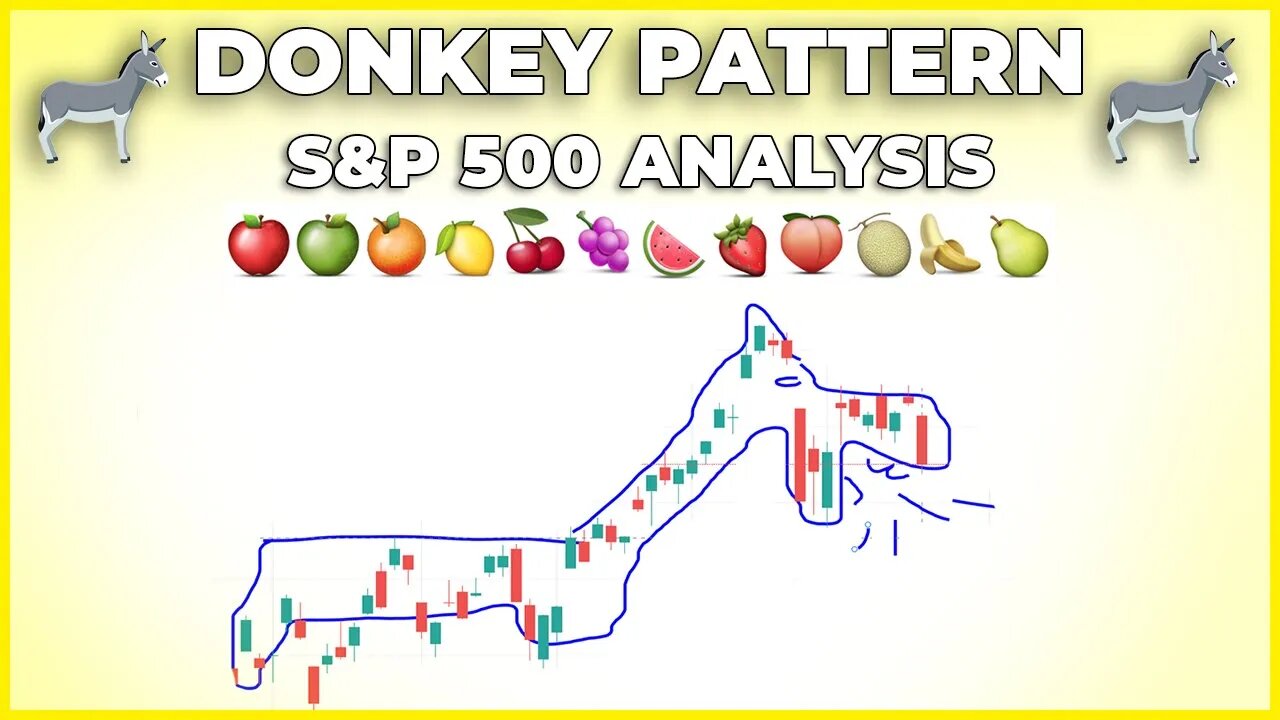
SP500 Donkey Pattern (The Feds Inside Joke) | S&P 500 Technical Analysis
In today's S&P 500 Technical Analysis update we review the price action on the daily timeframe and 30 minute candlestick charts.
I will discuss support and resistance levels on the SP500 as well as review any patterns that appear to have formed.
Today formed an evening star pattern on the daily timeframe and broke out of the bull flag we mentioned on previous stock market forecast videos.
The evening star candlestick pattern is a sign of a bearish reversal. I still plan on sitting on the sidelines and waiting patiently for the SP500 to touch the $3000 support range or breakout to to close the window at $3200.
TIMESTAMPS:
Intro: 00:00
SP500 Daily: 00:23
Evening Star Pattern: 00:45
SP500 30 Min: 07:49
Concluding Message: 12:54
Donkey Pattern: 13:18
Coco Burps: 14:11
Shhh : 15:23
Previous S&P 500 Technical Analysis Forecast:
○ https://youtu.be/Z_YxowCMDUk
MY FAVORITES - https://amz.run/3JLv
○ Book Recommendations
○ My Studio Setup
○ Morning Coffee
STOCK TRADING PLATFORM
○ Webull (GET 2 FREE STOCKS): https://bit.ly/37wobNT
COME SAY HI:
Instagram: https://www.instagram.com/figuringoutmoney
Twitter: https://twitter.com/mikepsilva
Make sure to SUBSCRIBE to my channel!
DISCLAIMER: I am not a professional investment advisor, nor do I claim to be. All my videos are for entertainment and educational purposes only. This is not trading advice. I am wrong all the time. Everything you watch on my channel is my opinion. Links included in this description might be affiliate links. If you purchase a product or service with the links that I provide I may receive a small commission. There is no additional charge to you! Thank you for supporting my channel :)
#SP500 #TechnicalAnalysis
-
 24:50
24:50
Figuring Out Money
1 year ago $0.01 earnedThe Stock Market's Biggest Competitor Is Looking Better And Better.
55 -

The StoneZONE with Roger Stone
3 hours agoLAWFARE! Are Trump's Legal Assaults Winding Down? w/ Impeachment Lawyer David Schoen | The StoneZONE
5.16K -
 1:01:43
Patriots With Grit
21 hours agoShocking Changes Are Coming, If You Can Believe It | John Richardson
2.26K1 -
 8:00:59
Dr Disrespect
9 hours ago🔴LIVE - DR DISRESPECT - MARVEL RIVALS - TOP 500 IN THE WORLD
133K26 -
 54:46
54:46
LFA TV
1 day agoThe Soon-Coming Social Millennium | TRUMPET DAILY 1.13.25 7pm
14.3K1 -
 1:00:03
Sarah Westall
2 hours agoWeaponized Chaos – Worst in Modern History; Changing Geopolitical Landscape w/ Andy Schectman
13.1K2 -
 LIVE
LIVE
SpartakusLIVE
3 hours ago#1 Hacker/Scammer PLUNGES into CRYPTO || !crypto !spartacoin
252 watching -
 53:15
53:15
Kimberly Guilfoyle
6 hours agoCalifornia Residents Demand Answers, Live with Rep Vince Fong, Mike Davis, and Paul Peterson | Ep. 188
50.8K57 -
 1:49:51
Redacted News
6 hours agoEMERGENCY! 10 MILLION UNDER FIRE WARNING & 100 MPH WINDS, NEWSOM UNVEILS CALIFORNIA 2.0 PLAN
138K199 -
 49:33
49:33
Candace Show Podcast
5 hours agoI Respond To Mr. And Mr. Macron | Candace Ep 131
112K303