Premium Only Content

SP500 BULL TRAP WARNING SIGN (Keep An Eye On This Chart) | S&P 500 Technical Analysis
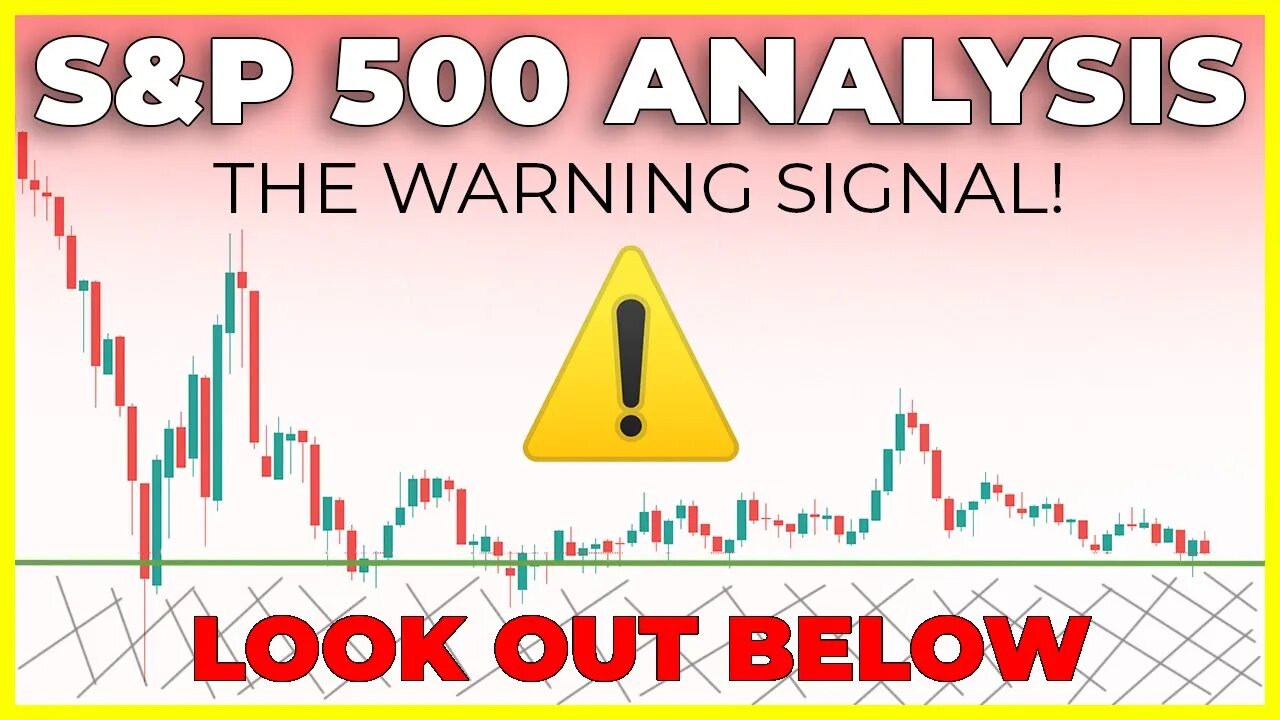
This is the Most important SP500 (S&P 500) Technical Analysis to date. I will be talking about a leading indicator for the S&P 500 that warned us of the stock market crash that took place February 2020, and how that indicator is once again flashing a red warning sign.
The warning sign that i am talking about is the 10yr treasury bond. When there is a divergence between the 2 the 10 yr bond typically give us a head start as to what will take place in the stock market which can help technical traders and investors forecast the current stock market.
By no means is this a end all be all indicator, however when we see this type of spread take place as shown on the FRED chart we typically see the SP500 shortly thereafter follow the 10 yr treasury bonds lead.
PLEASE NOTE: the FRED chart is the 10yr minus the 2 yr government bond. The support line mapped on the candlestick chart is of just the 10 yr bond. Still in my personal opinion is very relevant.
The FRED Chart Comparison:
https://fred.stlouisfed.org/graph/?g=74l2
MY FAVORITES - https://amz.run/3JLv
○ Book Recommendations
○ My Studio Setup
○ Morning Coffee
STOCK TRADING PLATFORM
○ Webull (GET 2 FREE STOCKS): https://bit.ly/37wobNT
COME SAY HI:
Instagram: https://www.instagram.com/figuringoutmoney
Twitter: https://twitter.com/mikepsilva
Make sure to SUBSCRIBE to my channel!
DISCLAIMER: I am not a professional investment advisor, nor do I claim to be. All my videos are for entertainment and educational purposes only. This is not trading advice. I am wrong all the time. Everything you watch on my channel is my opinion. Links included in this description might be affiliate links. If you purchase a product or service with the links that I provide I may receive a small commission. There is no additional charge to you! Thank you for supporting my channel :)
-
 23:55
23:55
Figuring Out Money
1 year agoWeird Things Are Happening Right Now
35 -
 3:49:06
Alex Zedra
9 hours agoLIVE! New Game | Nuclear Nightmare
48K7 -
 25:08
25:08
MYLUNCHBREAK CHANNEL PAGE
1 day agoUnder The Necropolis - Pt 2
161K52 -
 1:45:59
Spittin' Chiclets
1 day agoCanadian Chokejob - Game Notes Live From Chicago - 12.28.2024
199K29 -
 9:18
9:18
Space Ice
18 hours agoThe Guyver - Alien Bug Suits, Exploding Dragons, & Mark Hamill - Weirdest Movie Ever
40.2K22 -
 12:46
12:46
RealReaper
2 days ago $7.24 earnedMufasa is a Soulless Cash Grab
72.8K7 -
 5:14:24
FusedAegisTV
19 hours agoWelcome to The King of Iron Fist Tournament! \\ TEKKEN 8 Stream #1
128K1 -
 DVR
DVR
Bannons War Room
1 year agoWarRoom Live
101M -
 5:42:36
FreshandFit
1 day agoLive X Censorship For Opposing Immigration?!
239K117 -
 1:08:16
Tactical Advisor
20 hours agoNEW Budget Glocks | Vault Room Live Stream 011
123K4