Premium Only Content

2022-03-18: Analyzing Vaccine Side Effects. Part 1 (Seminar)
The Zoom recording of the Seminar ( Data Science using Open Canada Data) animated by Dmitry Gorodnichy. 2022-03-18. Ottawa.
Jason Morphett (former senior data scientist of British Telecom) is joining us from UK.
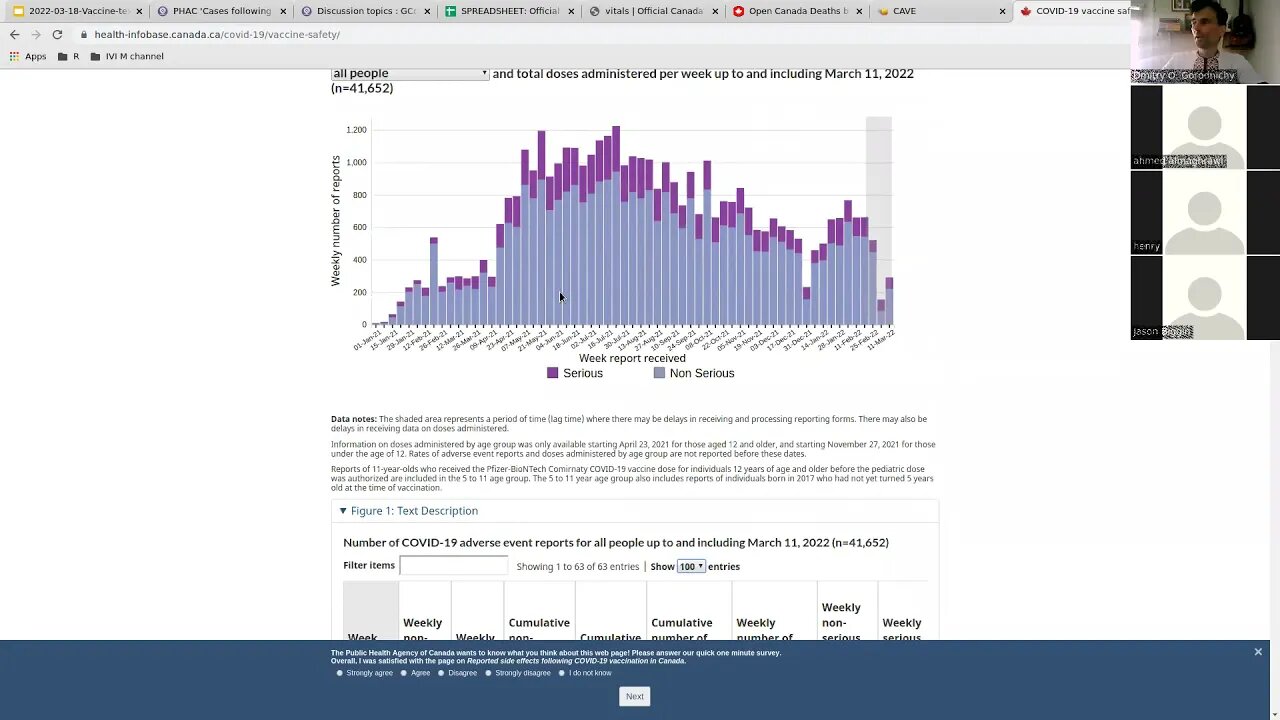
We talk about official data that have been collected by Canadian, UK and US governments related to vaccine efficiency and side-effects, and how we can analyze and visualize it using contemporary data science tools.
Dmitry talks about Canadian data and tools we developed here. Jason talks about UK and US data and the tools developed there. He describes The Coronavirus Adverse Vaccine Event (CAVE) project and present the Shiny App that he developed that performs semantic search and text analysis of US Government 's Vaccine Adverse Events database: https://vaccines.shinyapps.io/cave/.
This is the first half of the presentation.
The codes and slides from this presentation : https://github.com/IVI-M/cave/
Official US vaccine side-effect data : https://vaers.hhs.gov/data/datasets.html (data dictionary: https://vaers.hhs.gov/docs/VAERSDataUseGuide_en_September2021.pdf)
Official Canada vaccine side-effect data: https://health-infobase.canada.ca/covid-19/vaccine-safety/
Official Canada vaccine "efficiency" data: https://health-infobase.canada.ca/covid-19/epidemiological-summary-covid-19-cases.html#9
Googlesheet (with raw Official Canada data, graphs and calculations): https://www.ivim.ca/data
GitHub: https://ivi-m.github.io/vitals (forked from https://open-canada.github.io/vitals)
More Analysis: https://www.IVIM.ca
Interactive Death by Cause Tracker and Calculator: https://www.IVIM.ca/app
Follow us:
YouTube: https://www.youtube.com/user/IVI0IVI
Twitter: https://twitter.com/Gorodnichy_Dm
FaceBook: https://www.facebook.com/people/Dmitry-O-Gorodnichy/100010429878764/
-
 6:25:47
SynthTrax & DJ Cheezus Livestreams
19 hours agoDJ Cheezus & DEF JAM Fight for NY on PS2 - Hip Hop Violence and Vibes (1pm PST / 4pm EST)
101K4 -
 2:01:47
Nerdrotic
14 hours ago $14.39 earnedEgypt, Peru and Guatemala Luke Caverns RETURNS! | Forbidden Frontier #082
86.1K10 -
 LIVE
LIVE
Vigilant News Network
14 hours agoFDA Approves Trials for New “Pandemic” Vaccine | Media Blackout
1,969 watching -
 4:06:21
GamerGril
15 hours agoIM THE GREASTEST OF ALL TIME AT.... CHAOS | DAYS GONE
124K12 -
 3:00:18
Due Dissidence
1 day agoTHE PEOPLE VS NATURE by Kevin Augustine - plus a talkback w/ Jimmy Dore
141K22 -
 6:02:06
Rotella Games
21 hours agoMake the Hood Great Again | Day 3 | GTA San Andreas
93.6K6 -
 2:50:48
PudgeTV
21 hours ago🟡 Practical Pudge Ep 48 with "Willie Faulk" | Catching Up With Old Friends
81.4K3 -
 18:32
18:32
Forrest Galante
1 day ago5 Extinct Animals That I Believe Could Still Be Alive...
183K39 -
 DVR
DVR
Major League Fishing
3 days agoLIVE! - General Tire Team Series: Summit Cup - Day 1
169K7 -
 7:05:23
Hevel Gaming
1 day ago $70.20 earnedNCAAF Tennessee at Georgia While with Heroes of Might and Magic III & Helldivers 2
263K26