Premium Only Content

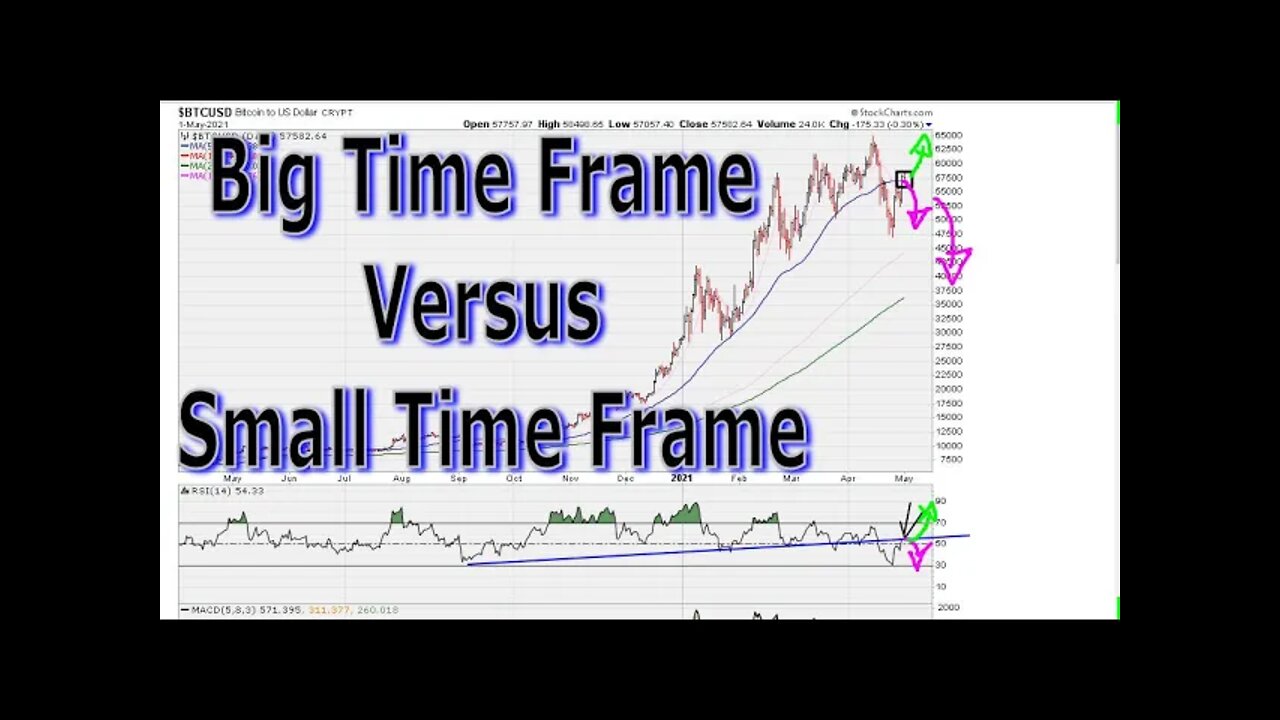
Big Time Frame Versus Small Time Frame - #1381
A https://www.muathe.com/ Original Concept!
Using Mostly Original https://www.muathe.com/ Concepts!
Dear Otherselves... Because you have chosen to use your free will to concentrate your divine awareness to the so called future happenings, that - frankly/paradoxically - in truth don't exist, you will continue to experience the catalysts of mental/psychological suffering until such a moment when you consciously return your awareness, grace, gratitude, hope, faith, love, attention, gaze, wonderment to the everlasting Love-Light Light-Love NOW moment. And so it is... THERE IS NOTHING BUT THE CREATOR, All Is One - There Is No Other Truth. https://www.youtube.com/watch?v=5Ixdv9pRj-g&t=3315s
Remember the big picture always trumps the small time frame.
Big Time Frame RSI 69.1 Power Versus Small Time Frame RSI 61.8 Divergence - Part 1/3 - #1376
https://youtu.be/iHmBIG7Uz34
Big Time Frame RSI 69.1 Power Versus Small Time Frame RSI 61.8 Divergence - Part 2/3 - #1377
https://youtu.be/2iEzOr89Qn0
Big Time Frame RSI 69.1 Power Versus Small Time Frame RSI 61.8 Divergence - Part 3/3 - #1378
https://youtu.be/icWsKg0XnqQ
Uniformity and Negative Divergence - #732
https://youtu.be/yC12pP0oPjQ
"Single RSI Long-Term Lines"
https://www.youtube.com/playlist?list=PLjHhEQ5LDpkbdDw1HvcyDOLq7EgGWzXXF
Stock Charts RSI 30 Level & RSI 70 Level Explained
https://www.youtube.com/playlist?list=PLjHhEQ5LDpkaILP62YdqCXyHmndnhU4u1
Check out this video on phi or golden mean or 1.618 https://www.youtube.com/watch?v=fvdmISdytXg
There is a need to extend major RSI trend lines since they do offer some hidden signals down the road. Here is a good example.
We look at how to draw simple lines on the RSI to determine where the odds of price movement seem to be pointing to.
And don't forget to account to uniform or symmetric RSI support or rejection on any previously important RSI line as per the instrument's own trading history.
"Daily 2-Minute Chart Study #350: The 27 Year Old - Sentiment - Memory Line"
https://youtu.be/XYxf4hnJJqU
"Uniformity"
https://www.youtube.com/playlist?list=PLjHhEQ5LDpkZnwHCqMVKNLu0n0YTffk66
"RSI Divergence 2.0 & Uniformity"
https://www.youtube.com/playlist?list=PLjHhEQ5LDpkb8JhsWT166IiNBFtZMJwLn
"RSI 50 Level Uniform Support or Rejection "
https://www.youtube.com/playlist?list=PLjHhEQ5LDpkZy6WqgZkBGhDt-LzoRDvYT
RSI 50 crossing, sell signals, uniformity, single line, 30.9, 69.1, worst type of negative divergence.
#Cryptos, #Cryptocurrencies, #BITCOIN, $BTC.X, $BTCUSD, #BTCUSD, $OMG.X, $OMGUSD, $ETHUSD, $ETH.X, $LTCUSD, #Etherium, $LTCUSD, #LiteCoin, $LTC.X, $XRP.X, $XPRUSD, #Ripple, #DOGECOIN, $DOGEUSD, $LINK.X, $LINKUSD,
TAGS
top ten stocks to buy,
stock analyst,
best stocks to buy this year,
stock buying,
hot penny stocks to buy,
best shares,
top ten stocks to invest in,
top companies to invest in,
stock market news today,
stock investor,
top stocks to buy this year,
great penny stocks,
stock finance,
live stock quotes,
nyse stock quotes,
highest stock,
stock trading sites,
stock market data,
#MemoryLines, #Uniformity, #RSI
-
 19:54
19:54
Muathe.com
1 year ago $0.02 earned🟢 MAJOR Bear Market Has Began!? Stocks, Crypto
85 -
 17:01
17:01
Turning Wrenches
2 years agoSmall Barn Build Time Lapse Part 3 of 3
172 -
 21:57
21:57
Turning Wrenches
2 years agoSmall Barn Build Time Lapse Part 2 of 3
9 -
 LIVE
LIVE
We Like Shooting
15 hours agoWe Like Shooting 593 (Gun Podcast)
108 watching -
 LIVE
LIVE
Flyover Conservatives
21 hours agoJack Hibbs Blasts California Leaders: Must-Watch!; Can Trump Fix the Mess? How Long will it Take? - Dr. Kirk Elliott | FOC Show
937 watching -
 LIVE
LIVE
DillyDillerson
1 hour agoTalking to the moon!! Just some live views of the FULL MOON!!
156 watching -
 1:29:29
Glenn Greenwald
6 hours agoWith Biden Out, U.S. Finally Admits Harms of His Israel / Gaza Policy; Biden Pays Homage To George W. Bush; Insane Women’s Tennis Scandal: An “Abusive” Coach | SYSTEM UPDATE #388
35.8K37 -
 LIVE
LIVE
Danny Polishchuk
8 hours agoWho's To Blame For LA Fires, Jewish Tunnels Update + Forbidden Anthropology
307 watching -
 1:08:10
Donald Trump Jr.
8 hours agoOne Week Until Inauguration, Live with Rep Anna Paulina Luna & Sen Tommy Tuberville
106K115 -
 1:00:13
The StoneZONE with Roger Stone
4 hours agoLAWFARE! Are Trump's Legal Assaults Winding Down? w/ Impeachment Lawyer David Schoen | The StoneZONE
23.7K