9 months agoAgile Metrics and Excel Template:(Scrum Metrics and KPI | VELOCITY, BURN DOWN CHART, DEFECT LEAKAGE)JogoCoach
1 year agoEasiest Excel Waterfall Chart (Bridge graph) from Scratch - Works with minus valuesLeila Gharani
1 year agoBetter Excel Variance Charts to show percentage change (Simple & uncommon technique)Leila Gharani
3 years agoPatterns in Harmful Toxic COVID Vaccines (Moderna, Pfizer, Johnson)Censored Important Videos
8 months agoUnleashing the Power of the Perplexity AI called Athena: Teaching Machines to Think Like Humans!Spicy_Spleen
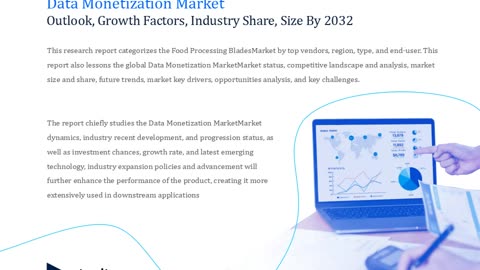
3 months agoData Monetization Market Research Report: In-depth Analysis and Market Intelligencesakshi25
3 months agoBroadcast Scheduling Software Market Intelligence Report: Unveiling Actionable Insights for Successsakshi25
2 years agoAUSTRALIAN DEATHS ARE OFF THE CHARTS & GLOBO VS HUMAN - DIRECT COMPARISON (SHARE)Humanity Is Under Attack