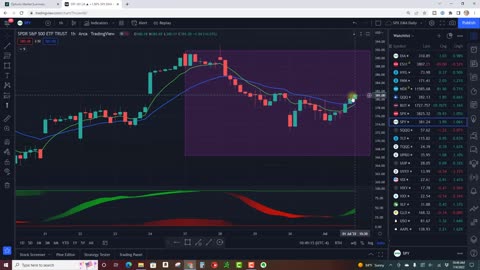
9 months agoStock Chart Technical Analysis (Bullish Engulfing) Candlestick Chart Pattern AnalysisAscencore
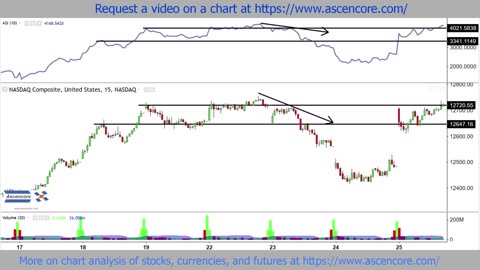
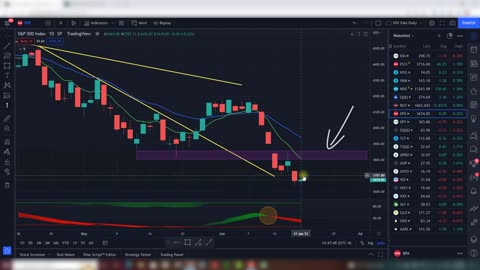
10 months agoNASDAQ Composite Stock Chart Accumulation Swing Index (ASI) Indicator Analysis ExampleAscencore
8 months agoLuckin Coffee (LKNCY) Stock Chart Analysis Fibonacci Channel Time Analysis ExampleAscencore
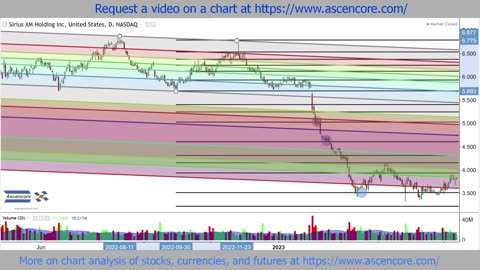
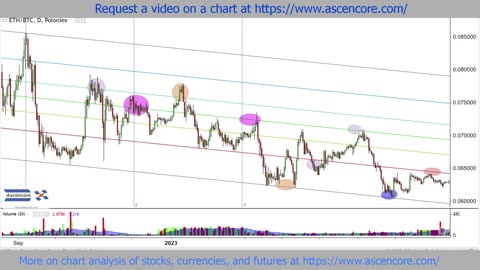
8 months agoFibonacci Channels Combined With Retracements For Time Analysis SIRI Stock Chart ExampleAscencore
2 months agoMonica Crowley: Global recession likely on the horizon following stock market carnageJust the NewsVerified
9 months ago(LULU) Stock Chart Analysis Of Defined Gaps & Trading Ranges With The Balance Of Power IndicatorAscencore
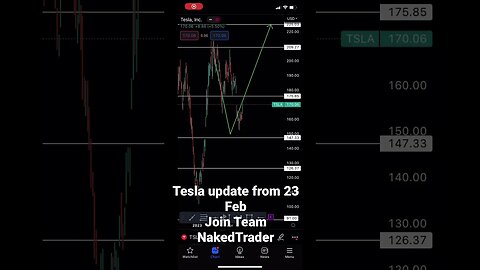
1 year agoTesla stock analysis update | #teslastock #analyse #shortsUnleash your inner trader with Team NakedTrader!