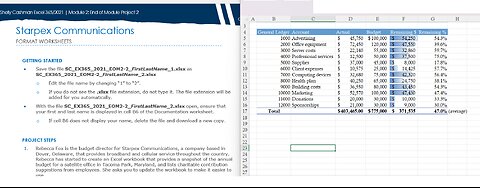
1. Pt 1 Excel Graphing w Error Bars

    Pt 1 Excel Graphing w Error Bars

    81
    19
    1.41K
  2. Shelly Cashman Excel 365/2021 | Module 2: End of Module Project 2 Starpex Communications

    Shelly Cashman Excel 365/2021 | Module 2: End of Module Project 2 Starpex Communications

    22
  3. Easiest Step Chart in Excel (this trick will surprise you!)

    Easiest Step Chart in Excel (this trick will surprise you!)

    3
    0
    8
  4. How to Create Result Card in JavaScript | Mark sheet | result card design | result sheet | Mr Tech

    How to Create Result Card in JavaScript | Mark sheet | result card design | result sheet | Mr Tech

    108
  5. Jeff Nippard's Program: IS IT WORTH IT?

    Jeff Nippard's Program: IS IT WORTH IT?

    2
    0
    136
    1
  6. Easiest Excel Waterfall Chart (Bridge graph) from Scratch - Works with minus values

    Easiest Excel Waterfall Chart (Bridge graph) from Scratch - Works with minus values

    4
    0
    18
  7. Excel Arrow Variance Chart: Dynamic Arrows in Chart to Show Change to Previous Year / Budget

    Excel Arrow Variance Chart: Dynamic Arrows in Chart to Show Change to Previous Year / Budget

    5
    0
    25
  8. Better Excel Variance Charts to show percentage change (Simple & uncommon technique)

    Better Excel Variance Charts to show percentage change (Simple & uncommon technique)

    5
    0
    23
  9. How to make a completion chart in under 60 secondsLevel up in Excel #ytshorts #excel

    How to make a completion chart in under 60 secondsLevel up in Excel #ytshorts #excel

    316