2 years agoGraphina Intro | Dynamic Charts, Graphs & Datatables For Elementor | Iqonic DesignIqonicDesign
1 year ago"Unlocking Radiologic Technology Careers: Your Path to a High-Paying, Impactful Healthcare Role!"Radiologic Technology Lessons
1 year agoWHAT is NEUROINTERVENTIONAL RADIOLOGY!! : How Neurointerventional Radiology Saves Lives!"Radiologic Technology Lessons
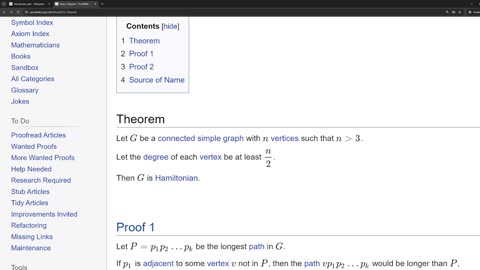
5 months agoThe incorrect proof of the Dirac's theorem about Hamiltonian graphs on ProofWikiMathematical Bunker
1 year ago#2 Matt Hancock: "The new variant is out of control. The cases, as you've seen from the graphs, have absolutely rocketed in the last few daysRedpillUSAPatriotsVerified
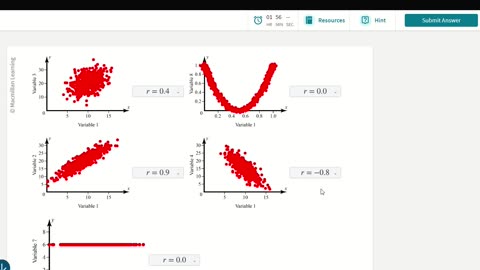
4 months agoStatistics Help: Each of the following graphs show the relationship between two variablessaxi753
2 years agoESCANDALO Pfizer reconoce ante el parlamento europeo que la vacuna COVID nunca fue testadasevillanoRULES
2 years agoHow To Download And Install Minitab 2022 Full | Minitab Statistical Software | Software StudioSoftware Studio
9 months agoEthical Hacker Exposes Horrors Of Covid-19 Vaccine From EudraVigilance Reporting SystemSunfellow On COVID-19