1 month agoThe strongest indicator for trading binary options and Forex the Zain indicator, a full explanationBinaryOptions99
1 year ago$USDT.D / USDT Dominance - 1H Update In my analysis of the USDT.D chart, it appears promisingStormTrading
1 year agoStock Chart Technical Analysis (3 Methods Rising) Candlestick Chart Pattern AnalysisAscencore
1 year agoMastering the W Pattern: A Guide to Spotting and Trading this Crypto Chart FormationNASAGovVideoss
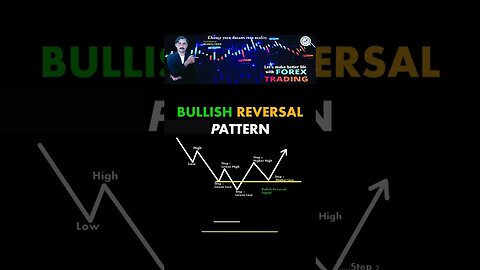
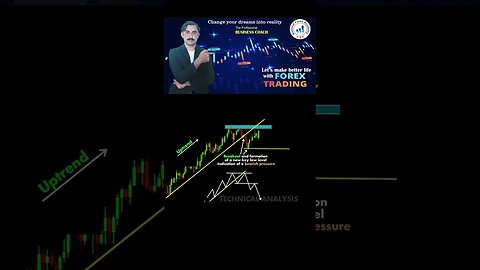
1 year agoBullish Reversal Chart Pattern | price action| technical analysis| trendline| national forex academySadarkhan
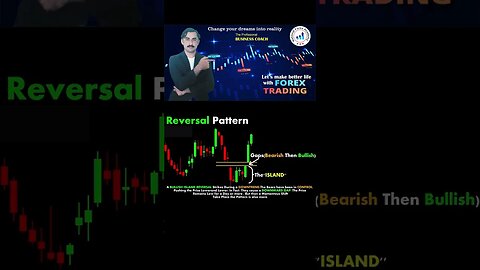
1 year agoReversal Chart Patterns |price actin |technical anaylsis |trendline |national forex academySadarkhan
2 years agoThe shooting star chart patterns|price action|technical analysis|trendline|national forex academySadarkhan
2 years agoThe perfect entry chart patterns|price action| technical analysis|trendline|national forex academySadarkhan
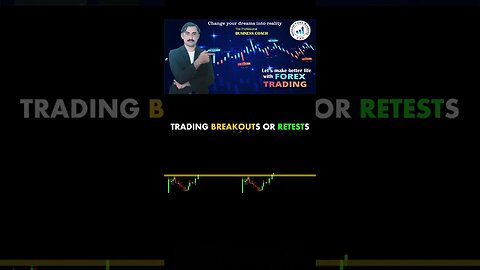
2 years agoTrading breakouts or retests chart patterns|price action|technical analysis|trendline|national forexSadarkhan
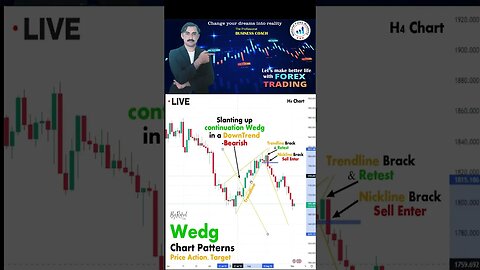
2 years agoWedg chart patterns|price action|technical analysis|trendline|national fotex academy|mohammad sadarSadarkhan
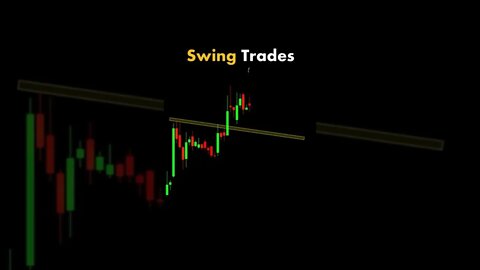
2 years agoSwing trades| Chart Pattern|How to trade | deriv| Reversal Chart | continental Chart | forex tradingSadarkhan
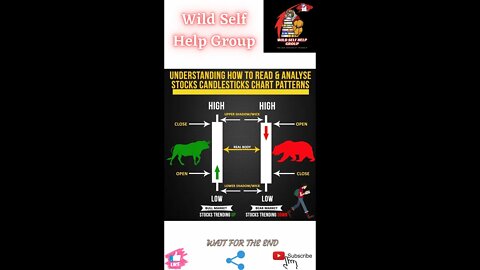
2 years ago🔥Understanding stocks candlestick chart pattern🔥#shorts🔥#viralshorts🔥#motivation🔥#wildselfhelpgroup🔥Wild Self Help Group