11 months agoIBM Stock Chart Analysis Example Case Study 4 Stable & Unstable Short Term Movement IdentificationAscencore
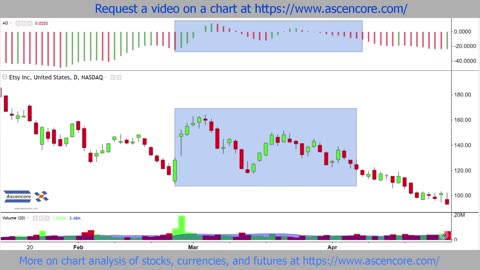
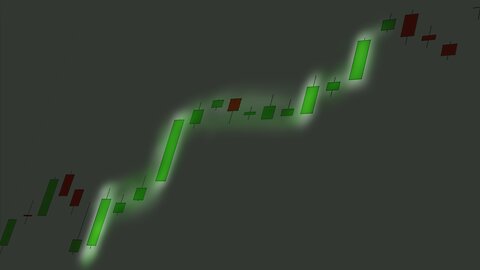
10 months agoStock Chart Technical Analysis (3 Methods Rising) Candlestick Chart Pattern AnalysisAscencore
1 month agoStock Market Analysis with Phil Grande of Phil's Gang Radio Show 10/11/2024thephilsgangVerified
1 year agoMaster Class - Training Stops, Scalping Analysis & Channel Levels In The Stock MarketAmerican Dream Trading
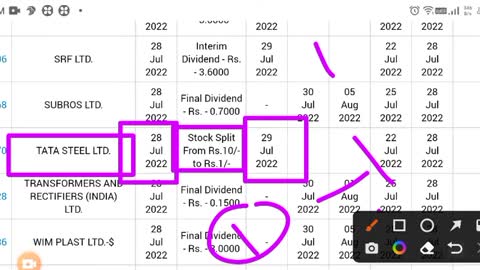
2 years agoTATA STEEL Share News Today - TATA STEEL Stock Latest News - TATA STEEL Stock Analysis - #tatasteelHessongHedberg
1 year agotata motors share news today in hindi _ tata motors stock latest news tomorrow stock analysis todayvanitaalmanza2977pro
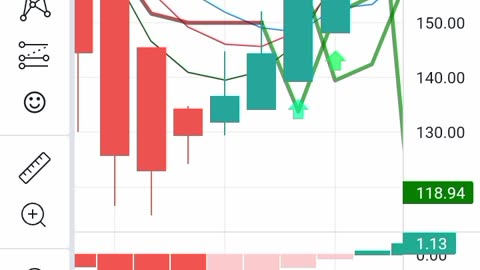
11 months agoNetflix (NFLX) Stock Chart Analysis With The Awesome Oscillator Twin Peaks SetupAscencore
10 months agoStock Chart Technical Analysis (Dark Cloud Cover) Candlestick Chart Pattern AnalysisAscencore
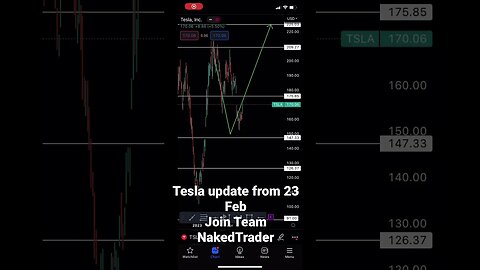
1 year agoTesla stock analysis update | #teslastock #analyse #shortsUnleash your inner trader with Team NakedTrader!