10 months agoEuro To US Dollar Exchange Rate EURUSD Chart Analysis With Fibonacci Speed Resistance FansAscencore
8 months agoStock Market Analysis with Phil Grande of Phil's Gang Radio Show 03/04/2024The Phil's Gang Radio Show ChannelVerified
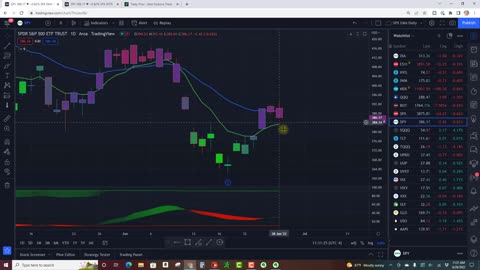
16 days agoStock Market Analysis with Phil Grande of Phil's Gang Radio Show 11/08/2024thephilsgangVerified
10 months ago(HPE) Hewlett Packard Stock Chart Analysis Using The Chande Momentum OscillatorAscencore
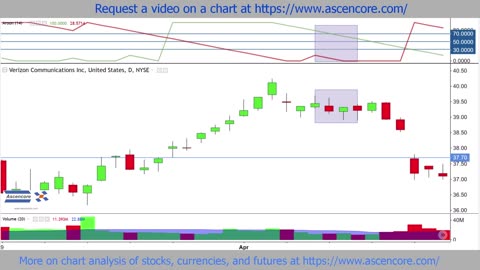
11 months agoVerizon Stock Chart Bullish Reversal Potential Analysis With The Aroon IndicatorAscencore
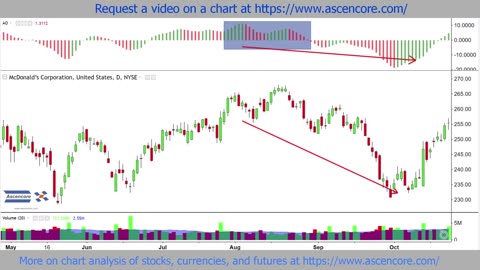
11 months agoMcDonald’s (MCD) Stock Chart Analysis With The Awesome Oscillator Twin Peaks SetupAscencore
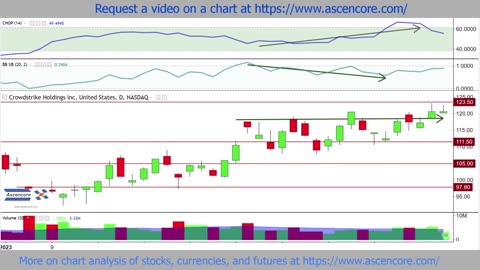
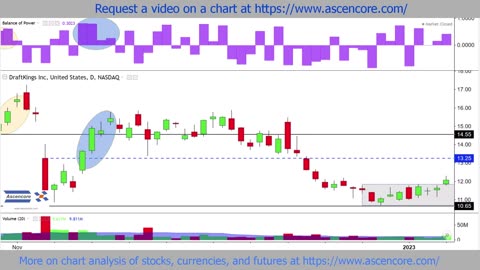
11 months agoBullish Stock Chart Analysis With The Balance Of Power Indicator (DKNG) ExampleAscencore
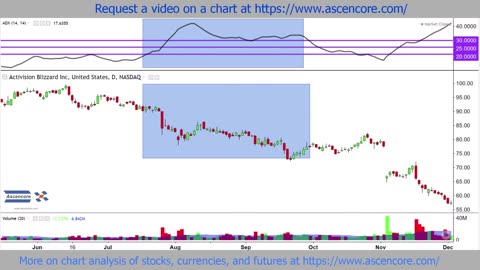
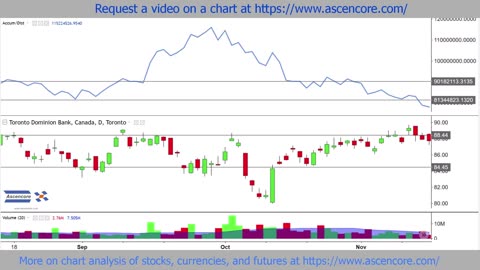
11 months agoToronto Dominion Bank (TD) Stock Chart Analysis With The Accumulation Distribution AD IndicatorAscencore