-
Statistics Help: The percentage of 46+ age group is - Frequency, Relative Frequency, Percentage
saxi753#Percentage #RelativeFrequency #Frenquency #StatisticsHelp16 views -
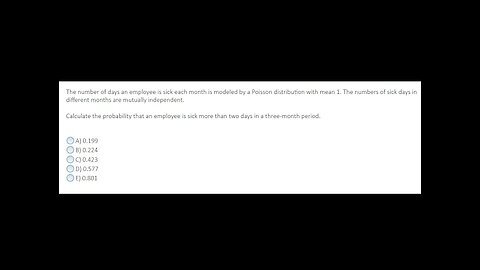
The number of days an employee is sick each month is modeled by a Poisson distribution with mean 1.
saxi753The number of days an employee is sick each month is modeled by a Poisson distribution with mean 1. #Probability #Statistics23 views -
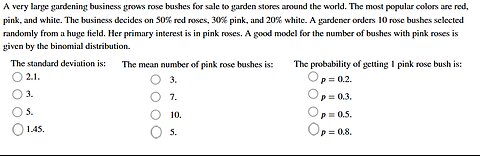
Statistics Help: A very large gardening business grows rose bushes for sale to garden stores around
saxi753A very large gardening business grows rose bushes for sale to garden stores around the world. The most popular colors are red, pink, and white. The business decides on 50% red roses, 30% pink, and 20% white. A gardener orders 10 rose bushes selected randomly from a huge field. Her primary interest is in pink roses. A good model for the number of bushes with pink roses is given by the binomial distribution. #StatisticsHelp #Techniques #BinominalDistribution18 views -
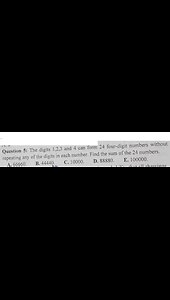
The digits 1,2,3 and 4 can form 24 four-digit numbers without repeating any of the digits in each
saxi753The digits 1,2,3 and 4 can form 24 four-digit numbers without repeating any of the digits in each number. Find the sum of 24 numbers #Digits #Arrangements #Statistics23 views -
Probability Help: Draw the tree diagram for rolling a 6-sided die,then flipping a coin.Add P at end
saxi753Here is the technique to solve this question and how to find them in step-by-step #ProbabilityHelp #TreeDiagram #Techniques32 views -
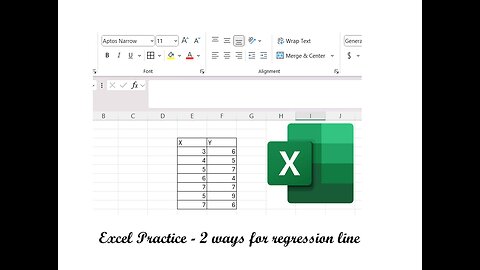
Excel: Two ways to make Regression Line on Microsoft Excel - Step-by-step
saxi753Here is the technique to solve the question related to regression line and how to find them in step-by-step #RegressionLine #MicrosoftExcel #Excel #Table19 views -
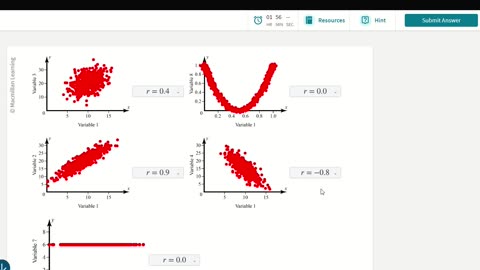
Statistics Help: Each of the following graphs show the relationship between two variables
saxi753Each of the following graphs show the relationship between two variables. Determine the Pearson product-moment correlation coefficient (r) for each graph. #StatisticsHelp #Variables #Correlationship42 views -
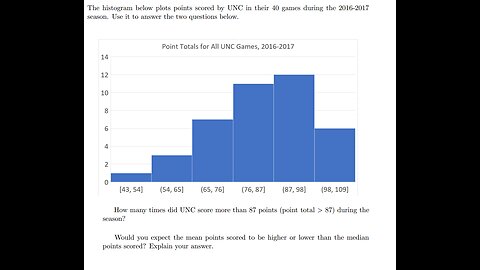
Statistics Help: The Histogram below plots points scored by UNC in their 40 games during 2016-2017
saxi753Here is the technique to solve the question related to Histogram and Statistics #Histogram #Statistics #Techniques #Distribution26 views -
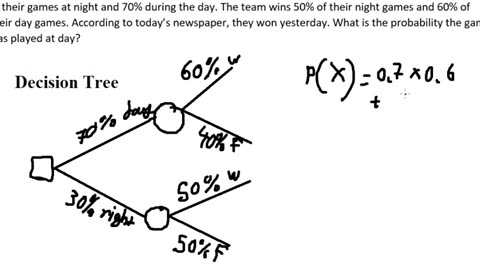
Statistics Help: The Ludlow Wildcats baseball team, a minor league team in the Cleveland Indians
saxi753Here is the full video how to solve the statistics by tree diagram with step-by-step #TreeDiagram #Statistics #Techniques56 views -
Statistics Help: How to draw the basic Scatter chart for Analysis - Excel Practice
saxi753Here is the basic techniques to solve how to solve the question related to Scatter chart. #Excel #Scatter #Chart #Statistics42 views